[ Home ] [
Memorial ] [ Writings ] [
Photo Album ] [ Links ]
Chapter 1
ELEMENTS OF THE PHYSICAL LAND USE SYSTEM
THE STRUCTURE - REGIONS, MARKET STATUS ZONES, PARCELS, NEIGHBORHOODS
|
The detailed land use map of Minnesota shows how nine major classes of land use are distributed among about 1.5 million forty-acre parcels in the state. The
land use of each forty-acre parcel is defined as the socio-economic function which is served by the greater part of the parcel. To perform its function, a forty may be either "developed" or "preserved".
The map in Figure 1 shows the same pattern in simplified form. Each areal unit is a Minor Civil Division (organized rural town or incorporated municipality) rather than a forty-acre parcel. Each Minor Civil Division (MCD) is classified according to the
Land Use Combination within it. Every MCD contains a mixture of different land uses dominating its component forty-acre parcels - a rural township typically contains 576 forties. The ingredients and proportions in the mix differ from one MCD to another.
When all of these different mixes are analyzed and grouped for the entire state, eighteen distinctive Land Use
Combinations emerge (Table 1). Each of the eighteen Land Use Combinations has its particular landscapes which reflect the combined works of men and nature. Their descriptions bring to mind a variety of scenes familiar to everyone who has travelled across Minnesota.
The eighteen Land Use Combinations actually form
many sub-regions within three major regions - Cultivation,
Transition, and Forest. Thus, the map in Figure 1 shows one important component of the structure of Minnesota's land use - the
pattern of regions and sub-regions. |
 |
- 9 -
Figure 1. Generalized land use map of Minnesota. Three major zones (regions) and eighteen subzones (sub-regions) are groups of townships and municipalities with similar dominant land uses. Since this map was prepared the Minnesota Land Management Study has developed a more refined technique for generalizing detailed land use data from 40-acre cells to larger units and, hence, to improve upon this map.
- 10 -
Table 1 - Land Use Combinations Used to Characterize Different Minor Civil Divisions (Rural Towns and Incorporated Municipalities) in Minnesota
Land Use
Combination |
Land Use Dominant
on Greatest Acreage |
Land Uses Present
in High Percentage
Compared with State Total |
Other Land Uses Present
in Moderate Percentages
Compared with State Totals |
Other Uses Present on
Small But Significant
Acreage |
Landscape Description |
|
Cultivated Zone
1
2
3
4 |
Cultivation
Cultivation
Cultivation
Cultivation |
Cultivation
Cultivation
Cultivation
Cultivation |
Open
Open |
Open, Extractive
Forest, Open, Extractive
Water, Marsh, Extractive Open
Forest, Marsh, Extractive |
Intensive cultivation on
prairie plains
Intensive cultivation with
scattered woodlands
Intensive cultivation with
scattered pasture
Intensive cultivation with
scattered pasture
and woodlands |
|
Transition Zone
5
6
7
8
9 |
Cultivation
Cultivation
Cultivation
Cultivation
Cultivation |
Water, Marsh
Water
Water |
Cultivated, Marsh, Open
Forest, Cultivated, Marsh.Open
Forest, Cultivation
Forest, Cultivation, Marsh, Open
Forest, Cultivation, Marsh,
Urban, Open |
Forest, Water, Extractive
Water, Urban, Extractive
Open
Urban
Extractive |
Cultivation with pasture
on rolling or rough land
Cultivation with pasture
and woodland on poorly
drained or rough areas
Cultivation with water,
forest, and pasture
Cultivation with forest,
pasture, and water;
sparsely developed
lakeshore
Cultivation with water,
forest, and pasture; much
developed lakeshore
|
Forest Zone
10
11
12
13
14
15 |
Forest
Forest
Forest
Forest
Forest
Forest |
Forest
Forest, Water
Forest, Water
Forest, Water
Forest, Extractive
Marsh |
Marsh
Marsh
Marsh
Urban
Water, Urban
Forest, Open |
Cultivation, Water, Urban, Open
Open
Urban, Open
Marsh, Extractive, Open
Open, Cultivation
Cultivation |
Forest
Forest with lakeshore
undeveloped
Forest with sparsely
developed lakeshore
Forest with much
developed lakeshore
Forest with extensive
mining
Marsh and Forest |
Urban Zone
16
17
18 |
Urban
Urban
Urban |
Urban
Urban
Urban |
Open
Water |
Cultivation, Forest
Open, Forest
Forest, Open, Cultivation |
Urban Development with
Scattered Farmlands
and Woods
Urban Development with
Some Lakeshore
Dense Urban Development |
- 11 -
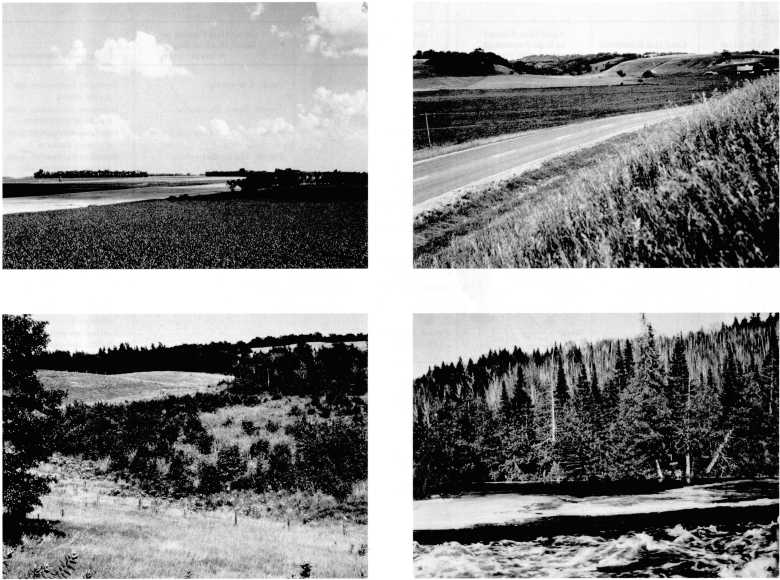
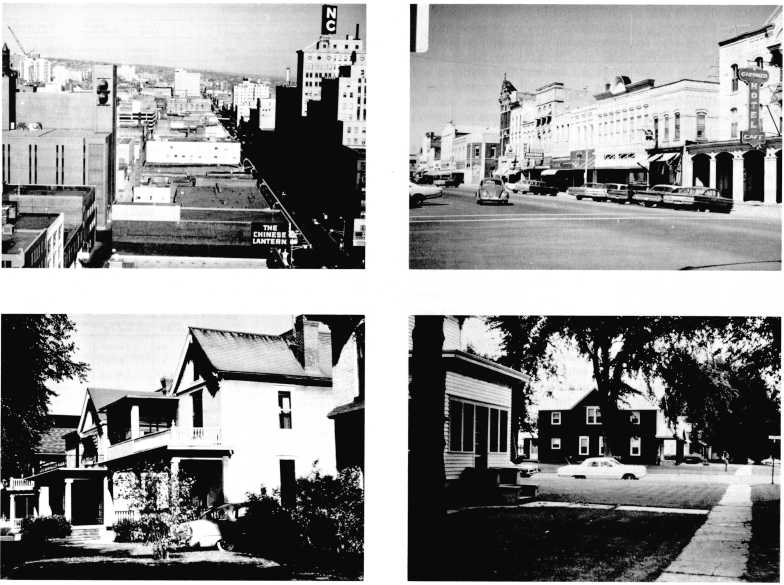
PLATE 1. The wide range of rural land use zones.
Top left. Land Use Combination #1 in Renville county. Only farmstead shelter belts and a few scattered fence-line tree plantations interrupt otherwise continuous cultivated area. (Courtesy of Karl
Raitz)
Top right. Land Use Combination #6 in western Winona county. Cultivated land is on glacial drift-covered uplands and drift-filled valley floors. Woods and pasture occupy steeply sloping, sometimes rocky valley walls.
Bottom left. Land Use Combination #6 in Isanti county. Pas-ture and woodland are the main uses of steep sides of stony hummocks and poorly drained potholes on the glacial moraine.
Bottom right. Land Use Combination #11 in Lake county. Mixed conifer-hardwood forest covers rough, rocky, glacier-scoured hills. Streams connect chains of lakes or ponds, with little or no shoreland development.
- 12 -
Another important component of the structure is the set of concentric zones created by decreasing intensity of
residential development, industrialization, and second homes out-ward from the center of the Twin Cities (Figure 2). These are zones of
metropolitan influence on the land market; they reflect differences in the metropolitan
market status of the land, regardless of its present use.
The impact of the Twin Cities metropolis on land value extends well beyond the urbanized area shown on the land use map in Figure 1. Within the region of one-hour travel time from the central cities, plans (anticipated land uses) are already formulated on the assumption that this region is now a part of the metropolitan land market (Figure 2).
Beyond the one-hour driving time line, a still larger contiguous area of the state experienced population growth in the past decade because of the influence of Twin Cities industrial dispersal or retirement-leisure home developments. Anticipated land uses in that region probably have begun to reflect expectation of a potential future urban land market.
In summary, current land use provides a basis for dividing the state into three broad
regions and many sub-regions. Superimposed on those patterns are the concentric
zones of urban influence.
Meanwhile, each Land Use Combination is composed of hundreds or thousands of ownership parcels - each one a measured areal unit of land which can be bought and sold. A typical parcel in rural areas is one or more forty-acre units in the government land survey, but it is almost always much smaller in urban areas. Every parcel has its own
neighborhood. That is the area in which any landscape feature of a given parcel is visible and as a result, either enhances or reduces the value of other parcels in the area. It is also the area in which emissions of light, noise, fluid, or solids from the parcel are present in amounts sufficient to be defined as noxious - either by law, regulation, or consensus of the local residents. A neighborhood may be one parcel or any combination of contiguous parcels that meet this definition.
- 13 -
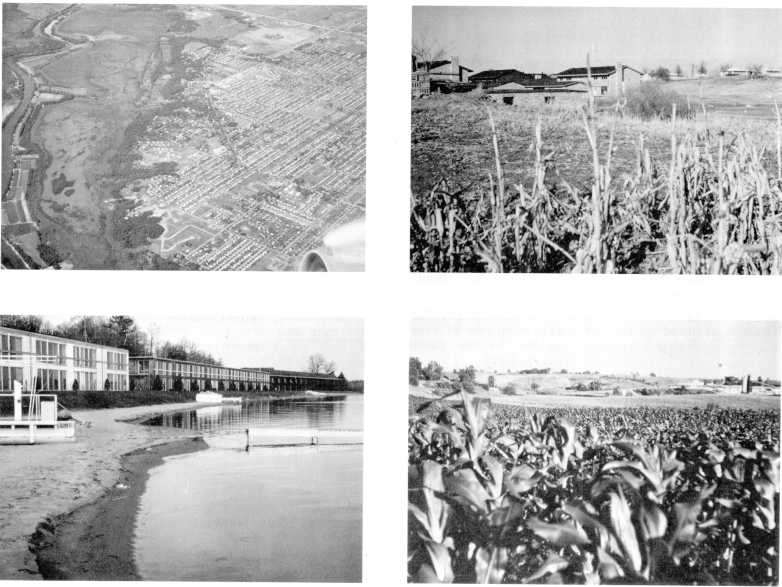
PLATE 2. The influence of urban expansion.
Top left. Tract housing expanded over former cultivated plain to the edge of the Minnesota River valley wall in southern Bloomington. Floodplain remains mainly unused.
Top right. Townhouse construction displacing crop land in northeast suburbs of Minneapolis.
Bottom left. Intensively developed lakeshore, Crow Wing county.
Bottom right. Crop and pasture land on hummocky, stony glacial moraine (Land Use Combination #6) which is now occupied by the Twin Cities' largest suburban retail-office complex (Land Use Combination #18). The Southdale area, south from 68th Street and France Avenue, as it appeared in 1952.
- 14 -
Figure 2. Generalized market status zones. The three zones of urban development or urban market influence are shown only for the Twin Cities.
- 15 -
Table 2 - Distribution of Land Use Classes in Each Land Use Combination (in acres)
| Land Use Combination |
Major Land Use Cases |
| Cultivation |
Forest |
Open |
Marsh |
Water |
Urban |
Extractive |
Total |
Cultivated Zone
1) Intensive cultivation on prairie plains
2) Intensive cultivation with scattered woodlands
3) Intensive cultivation with scattered pasture
4) Intensive cultivation with scattered pasture
and woodlands |
5,084,480
2,119,720
6,070,720
842,080 |
10,480
139,520
91,320
43,760 |
205,440
80,920
646,160
136,160 |
6,800
3,800
66,640
1,640 |
1,360
640
100,040
160 |
22,000
17,080
35,720
5,400 |
2,080
1,200
3,200
1,120 |
5,332,640
2,362,880
7,013,800
1,030,320 |
Transition Zone
5) Cultivation with pasture on rolling
or rough land
6) Cultivation with pasture and woodland
on poorly drained or rough areas
7) Cultivation with water, forest,
and pasture
8) Cultivation with forest, pasture, and
water; sparsely developed lakeshore
9) Cultivation with water, forest, and
pasture; much developed lakeshore |
2,056,280
3,579,000
1,485,240
817,920
555,840 |
104,880
1,469,280
595,960
212,160
301 ,400 |
764,480
1,772,600
326,960
240,000
283,600 |
59,960
185,640
425,280
48,440
54,080 |
42,280
80,040
511,760
223,360
335,560 |
49,400
165,200
12,720
38,320
169,880 |
2,600
4,840
920
200
1,400 |
3,079,880
7,256,600
3,328,840
1,580,400
1,701,760 |
Forest Zone
10) Forest
11) Forest with lakeshore undeveloped
12) Forest with sparsely developed lakeshore
13) Forest with much developed lakeshore
14) Forest with extensive mining
15) Marsh and forest |
670,240
188,840
50,720
57,720
16,440
94,000 |
7,270,640
5,972,040
736,960
746,200
438,560
210,360 |
944,240
238,840
72,840
89,320
47,160
105,800 |
423,160
325,200
29,960
19,520
4,160
205,720 |
142,360
1,415,880
185,520
203,920
21,560
4,640 |
78,440
52,880
27,000
82,600
28,000
1,360 |
3,720
1,840
80
880
62,280
80 |
9,532,800
8,195,520
1,103,080
1,200,160
618,160
621,960 |
Urban Zone
16) Urban development with scattered farmlands
and woods
17) Urban development with some lakeshore
18) Dense urban development |
34,240
7,760
8,400 |
15,240
10,440
2,200 |
32,280
10,800
3,600 |
3,840
3,000
200 |
3,560
15,000
2,040 |
188,360
109,080
135,040 |
640
80
0 |
278,160
156,160
151,480 |
| STATE TOTALS |
23,739,640 |
18,371,400 |
6,001,200 |
1,867,040 |
3,289,680 |
1,218,480 |
87,160 |
54,544,600 |
Acreages in this table are calculated from the data base of the statewide map,
Minnesota Land Use, 1969, published in 1971 by the University of Minnesota/ Center for Urban and Regional Affairs and the Minnesota State Planning Agency.
The basic data show the dominant land use for each 40-acre parcel in the United States land survey. All areas described in this and other tables have been measured in numbers of 40-acre parcels, each identified according to its dominant land use. To obtain the acreages shown in the tables, the number of parcels, in any given area or dominant land use, was simply multiplied by forty. Thus the number of acres has been estimated. Only the number of "forties" has been directly measured. As a result, acreage figures contain a small amount of error.
There is a tendency to overstate acreages for land uses which recur frequently
in small patches in a very mixed pattern - for example, pasture in the Transition Zone. Such a use may be the largest single one in many forties though accompanied by several other uses which are not noted. There is also a tendency to understate acreages of land uses which occur in small patches widely scattered, often present but almost never dominant in a forty. Gravel pits are an example. These errors cancel one another as the data are aggregated for larger areas. They are not
significant in the above table where the entry exceeds about four thousand acres. For a detailed analysis of this problem, see:
Joseph Stinchfield, A Statistical Evaluation of the Minnesota Land
Management Information System's Land Use Study, unpublished M.A. thesis in Geography, University of Minnesota, March 1972.
- 16 -
Table 3 - Distribution of Land Use Classes in Each Land Use Combination (in percent)
| Landscape Description |
Major Land Use Classes |
| Cultivation |
Forest |
Open |
Marsh |
Water |
Urban |
Extractive |
Total |
Cultivated Zone
1) Intensive cultivation on prairie plains
2) Intensive cultivation with
scattered woodlands
3) Intensive cultivation with
scattered pasture
4) Intensive cultivation with
scattered pasture and woodlands |
95.3
89.7
86.5
81.7 |
.2
5.9
1.3
4.2 |
3.9
3.4
9.2
13.2 |
.1
.2
1.0
.2 |
*
*
1.4
* |
.4
.7
.5
.5 |
*
*
*
.1 |
100.0
100.0
100.0
100.0 |
Transition Zone
5) Cultivation with pasture on
rolling or rough land
6) Cultivation with pasture and woodland
on poorly drained or rough areas
7) Cultivation with water, forest,
and pasture
8) Cultivation with forest, pasture, and
water; sparsely developed lakeshore
9) Cultivation with water, forest, and
pasture; much developed lakeshore |
66.8
49.3
43.1
51 .7
32.6 |
3.4
20.2
16.5
13.4
17.7 |
24.8
24.4
9.7
15.2
16.7 |
1.9
2.6
12.2
3 1
3.2 |
1.4
1.1
14.7
14.1
19.7 |
1.6
2.3
3.7
2.4
10.0 |
*
*
*
*
* |
100.0
100.0
100.0
100.0
100.0 |
Forest Zone
10) Forest
1 1 ) Forest with lakeshore undeveloped
12) Forest with sparsely developed lakeshore
13) Forest with much developed lakeshore
14) Forest with extensive mining
15) Marsh and forest |
7.0
2.3
4.6
4.8
2.7
15.1 |
76.3
72.8
66.8
62.2
70.9
33.8 |
9.9
29
6.6
7.4
7.6
17.0 |
4.4
4.0
2.7
1.6
.7
33.1 |
1.5
173
168
17.0
3.5
7 |
.8
.6
2.4
6.9
4.5
2 |
*
*
*
*
10.1
* |
100.0
100.0
100.0
100.0
100.0
100.0 |
Urban Zone
16) Urban development with scattered farm
-lands and woods
17) Urban development with some lakeshore
18) Dense urban development |
12.3
5.0
5.5 |
5.5
6.7
1.5 |
11.6
6.9
2.4 |
1.4
1.9
.1 |
1.3
9.6
1.3 |
67.7
69.8
89.2 |
.2
*
0 |
100.0
100.0
100.0 |
| STATEWIDE PERCENTAGE |
43.6 |
33.8 |
10.9 |
3.4 |
6.0 |
2.2 |
.1 |
100.0 |
*=less than .1%
EXPRESSION OF COMPLEX FORCES
The land use map is not simply a configuration of differently-labelled blocks to be shifted about like dominoes in a game or tiles in an artistic design. It is a reflection of the complexities of the state's land resource base together with the complex history of human settlement. Furthermore, it reflects some of the basic characteristics of Western society and the pursuit of certain fundamental long-term human goals by the people of Minnesota.
The different Land Use Combinations in Table 1 mirror the varying quality of the land resource - the hummocky glacial moraines, their thousands of localized flat and sandy outwash plains, and their thousands of lakes and ponds; the ice-scoured rocky ridges of the Arrowhead country; the rich and gently rolling prairie till plains of the south and southwest; the deep, twisting valleys and high, rolling divides of the southeast; the flat floor of the Red River Valley. But those landscape descriptions also reflect the different traditional views of what is good farmland and how to use it - views held by the
different nationalities who pushed the agricultural frontier northward and westward across the state. Hence rough and stony moraine land is cultivated in some areas, avoided in others. Forest has been cleared to make way for the plow in
some places, while similar forest on similar land is logged or virtually unused in other places.
- 17 -
Table 4 - Distribution of Public Ownership by Land Use Combination
| Landscape Description |
Land Owned By: |
Total Public
Ownership in each
Land Use Combination |
% of Total |
| Federal Government |
State Government |
County Government |
| Acres |
% of Total |
Acres |
% of Total |
Acres |
% of Total |
Cultivated Zone
1) Intensive cultivation on prairie plains
2) Intensive cultivation with scattered
woodlands
3) Intensive cultivation with scattered
pasture
4) Intensive cultivation with scattered
pasture and woodlands |
3,640
2,760
66,800
200 |
*
*
1.6
* |
10,560
5,480
61,520
7,400 |
.3
.1
1.4
.2 |
0
0
80
0 |
0
0
*
0 |
14,200
8,240
128,400
7,600 |
.1
*
1.1
* |
Transition Zone
5) Cultivation with pasture on rolling
or rough land
6) Cultivation with pasture and woodland
on poorly drained or rough areas
7) Cultivation with water, forest,
and pasture
8) Cultivation with forest, pasture,
and water; sparsely developed
lakeshore
9) Cultivation with water, forest,
and pasture; much developed
lakeshore |
48,160
55,480
470,080
35,600
36,720 |
1.1
1.3
10.9
.8
.9 |
45,480
171 ,000
468,720
25,160
32,080 |
1 .1
4.0
11.0
.6
.8 |
3,920
16,720
25,240
5,680
4,960 |
.1
.6
.9
.2
.2 |
97,560
243,200
964,040
66,440
73,760 |
.9
2.1
84
.6
.7 |
Forest Zone
10) Forest
11) Forest with lakeshore undeveloped
12) Forest with sparsely developed
lakeshore
13} Forest with much developed
lakeshore
14) Forest with extensive mining
15) Marsh and forest |
617,760
2,624,080
204,320
75,640
42,120
27,960 |
14.3
60.8
4.7
1.8
1.0
7 |
1 ,281 ,960
1,613,200
103,040
70,360
44,360
318,240 |
30.1
37.7
2.4
17
1.0
75 |
1,590,000
825,120
130,880
176,760
56,960
10,720 |
55.8
289
46
6.2
2.0
4 |
3,489,720
5,062,400
438,240
322,760
143,440
356,920 |
306
44.4
3.8
2.8
1.3
3.1 |
Urban Zone
16) Urban development with scattered
farmlands and woods
17) Urban development with some
lakeshore
18) Dense urban development |
280
2,120
160 |
*
*
* |
3,440
2,360
1,280 |
*
*
* |
0
0
0 |
0
0
0 |
3,720
4,480
1,440 |
*
*
* |
| TOTALS |
4,313,880 |
100.0 |
4,265,640 |
100.0 |
2,847,040 |
100.0 |
11,426,560 |
100.0 |
*=less than .1%
t=From: Land Use Classification Program, Department of Natural Resources, 1969
The acreage in different uses reflects great differences in both the
quality of the land its accessibility (Tables 2, 3). For example, more than half of all the state's cultivated land is on the naturally rich prairie soils. On the other hand, location of developed lakeshore is dependent not only on physical quality of the lake but also on its accessibility to major population centers. The different uses also reflect the
fundamental division of labor in our urbanized society. Occupational and economic specialization means differentiation of land uses - for cultivation, forestry, mining, urban development, and the transportation corridors to link these different uses and permit interaction between them.
- 18 -
The amount of land in public ownership is mainly a product of
past events and policies (Tables 4, 5). State and federal ownership has come about largely through twentieth century governmental action to retain public lands which had not already been alienated by private claims and to purchase additional land in accord with
preservation or recreational development programs. A substantial part of the state land and nearly all of the county land, on the other hand, is in public ownership as a result of the
avalanche of private forfeiture, for unpaid taxes, on the marginal farms and cut-over forests of northeast and north central Minnesota. The massive forfeiture began about 1900, toward the end of the lumbering era, and peaked during the great depression of the 1930's.
The most spectacular differences among the Land Use Combinations are measured in assessed valuation per acre (Table 6). The average assessed value per acre of dense urban settlement, for example, is almost three hundred times as high as the comparable average value for more than 3.3 million acres of marginal farm land in the Transition Zone. Minor civil divisions with marginal farm land but developed lakeshore have an average value per acre more than five times as high as MCDs on the best cropland in the state. But rural areas on high quality soils have assessed valuations per acre several times as high as those on mediocre soils. Thus, the pattern reflects differences in both
potential agricultural productivity and degree of urbanization. Differences in urban development, in turn, reflect the importance of accessibility to regional and national markets, the
rising levels of living, and the search for residential amenity that have accompanied the urbanization process.
Table 5 - Public Ownership as a Percentage of Total Area in Each Land Use Combination
| Landscape Description |
Total
Acreage |
Acres of
Public Ownership |
Public Ownership
As % of Total |
Cultivated Zone
1) Intensive cultivation on prairie plains.
2) Intensive cultivation with scattered woodlands
3) Intensive cultivation with scattered pasture
4) Intensive cultivation with scattered pasture and woodlands |
5,332,640
2,362,880
7,013,800
1,030,320 |
14,200
8,240
128,400
7,600 |
.3
.4
1.8
.7 |
Transition Zone
5) Cultivation with pasture on rolling or rough land
6) Cultivation with pasture and woodland on poorly drained or
rough areas
7) Cultivation with water, forest and pasture
8) Cultivation with forest, pasture, and water; sparsely developed
lakeshore
9) Cultivation with water, forest, and pasture; much developed
lakeshore |
3,079.880
7,256,600
3.328,840
1,580,400
1,701,760 |
97,560
243,200
964,040
66,440
73,760 |
3.2
34
29.0
4.2
4.3 |
Forest Zone
10) Forest
11) Forest with lakeshore undeveloped
12) Forest with sparsely developed lakeshore
13) Forest with much developed lakeshore
14) Forest with extensive mining
15) Marsh and forest |
9,532.800
8,195,520
1,103,080
1,200,160
618,160
621,960 |
3,489,720
5,062,400
438,240
322,760
143,440
356.920 |
36.6
61.8
39.7
26.9
23.2
57.4 |
Urban Zone
16) Urban development with scattered farmlands and woods
17) Urban development with some lakeshore
18) Dense urban development |
278,160
156.160
151,480 |
3,720
4,480
1,440 |
1.3
2.9
1.0 |
| TOTALS |
54,544,600 |
11,426,560 |
21.0 |
Table 6 - Distribution of Land Area and Assessor's Market Valuation in Each Land Use Combination
| Landscape Description |
LAND AREA |
ASSESSOR'S MARKET VALUATION 1972 |
| Acres |
% of
State Total |
Total Value
(thousands of $) |
Per Acre Value
($'s) |
% of Total
State Value |
Cultivated Zone
1) Intensive cultivation on prairie plains.
2) Intensive cultivation with scattered
woodlands
3) Intensive cultivation with scattered
pasture
4) Intensive cultivation with scattered pasture
and woodlands |
5,332,640
2,362,880
7,013,880
1 ,030,320 |
9.8
4.3
13.0
1.9 |
1,464,051
820,161
1,965,163
265,437 |
274.54
347.10
280.18
257.62 |
4.8
2.7
6.5
.9 |
Transition Zone
5) Cultivation with pasture on rolling
or rough land
6) Cultivation with pasture and woodland
on poorly drained or rough areas
7) Cultivation with water, forest, and
pasture
8) Cultivation with forest, pasture, and
water; sparsely developed lakeshore
9) Cultivation with water, forest, and
pasture; much developed lakeshore |
3.079,880
7,256.600
3,328.840
1,580,400
1,701,760 |
5.6
13.3
6.2
2.9
3.1 |
1,066,117
3,024,379
481,906
377,103
2,427,318 |
346.16
416.77
144.77
238.61
1,426.36 |
3.5
9.9
1.6
1.2
8.0 |
Forest Zone
10) Forest
11) Forest with lakeshore undeveloped
12) Forest with sparsely developed lakeshore
13) Forest with much developed lakeshore
14) Forest with extensive mining
15) Marsh and forest |
9,532,800
8,195,520
1,103,080
1,200,160
618,160
621,960 |
17.4
15.0
2.0
2.2
1.1
1 .1 |
555,649
198,406
89,192
341,782
376,872
15,388 |
58.28
24.21
80.86
284.78
609.67
24.74 |
1.8
0.7
0.3
1 .1
1.2
* |
Urban Zone
16) Urban development with scattered farmlands
and woods
17) Urban development with some lakeshore
18) Dense urban development |
278,160
156.160
151,480 |
0.5
0.3
0.3 |
5,929,984
4,625.659
6,402,405 |
21,318.61
29,621.28
42,265.68 |
19.5
15.2
21. 0 |
| TOTALS |
54,544,600 |
100.0% |
$30,426,972 |
$557.53 |
100.0% |
*=less than .1%
- 19 -
- 20 -
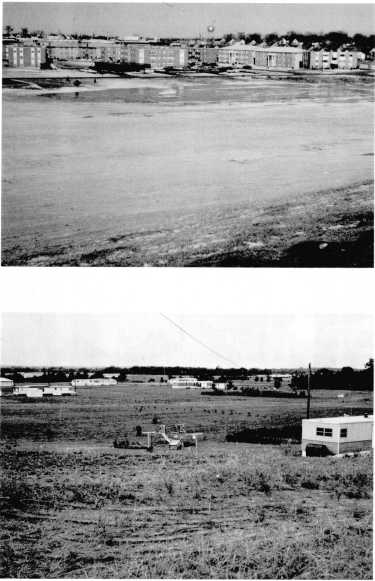 |
PLATE 3. The wide range of urban land uses.
Top left. Central Duluth - critical economic location on the map of the northwestern United States in the era of steam packet navigation on the Great Lakes.
Top center. Downtown Hastings - critical economic location in the era of steam packet navigation on the Mississippi River.
Top right. Large-scale 1960s apartment complex expanding across the floor of a former gravel pit, western suburbs of the
Twin Cities.
Bottom left. Turn-of century housing, Twin Cities.
Bottom center. Turn-of-century housing, Bird Island.
Bottom right. Mobile and modular homes on large acreages near Elk River. |
- 21 -

- 22 -
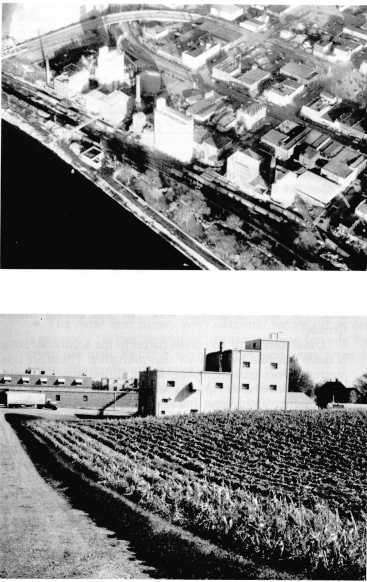 |
PLATE 4. The wide range of heavy industry locations.
Left. Taconite mine and processing plant on the Mesabi Range near Hoyt Lakes, typical of Land Use Combination #14. (Courtesy of Donald
Yaeger)
Top center. Taconite processing plant on the north shore of Lake Superior at Silver Bay, in sharp contrast with its
environment in Land Use Combination #12.
Bottom left center. Underdeveloped industrial land, Duluth-Superior harbor.
Bottom right center. Long-established pulp and paper mill on the Mississippi River at Sartell.
Top right. Long-established, tightly confined riverfront industrial district in Red Wing.
Bottom right. Modern food processing plant in the open country at
Bongards. |
- 23 -
Table 7 - Summary by Zone
| Zone |
Total
Acreage |
% of State
Total |
Acres of Public
Ownership |
% of Total
Zonal Acreage in
Public Ownership |
Zonal Public Land
as % of Total
Public Owned |
Total Value
(thousands of $) |
Per/Acre
Value ($) |
Value as %
of Total
State Value |
Cultivated Zone
Transition Zone
Forest Zone
Urban Zone |
15,739,640
16,947,480
21,271,680
585,800 |
28.9
31.0
39.0
1.1 |
158,440
1,445,000
9,813,480
9,640 |
1.2
8.5
46.1
1.7 |
1.4
12.7
85.8
* |
4,514,812
7,376,823
1,577,289
16,958,048 |
286.84
435.27
74.15
28,948.53 |
14.8
24.2
5.2
55.8 |
| TOTAL |
54,544,600 |
100.0 |
11,426,560 |
|
100.0 |
30,426,972 |
557.53 |
100.0 |
* Less than .1%
Thus, the map of land use is, in one sense, an historical document - a summary of the results of the spread of settlement and technology across the vividly varying land resources of the state, and a summary expression of such fundamental forces as urbanization, anticipation of change, the division of labor, the unequal distribution of resources and population, the distribution of wealth, and the search for amenity (Table 7).
But, in another sense, the land use map describes the
physical structure of a land utilization system. Major elements of the structure are the broad regions, the subregions, the rings of urbanization, the parcels, and neighborhoods.
MARKET STATUS AND ACCOMMODATION OF CHANGE
The structure of the land use system is subject to continuous
change. Change comes as a result of population growth or decline, evolution of
technology, and changes in all of the other characteristics of society which the land use map reflects.
These changes are accomplished through the purchase and sale of
land, or changes in the priorities for their land on the part of people who are retaining ownership. Each parcel, subregion, or region, with its distinctive land use, represents a distinctive set of development decisions; and the boundaries between the regions or parcels are frontiers which shift as development occurs or ownership and priorities change.
Thus the entire land use structure can be viewed as a set of development zones and frontiers, with their accompanying
variations in land values and priorities for land utilization. Each zone has a distinctive
market status within the land use system (Figure 2).
- The urbanized zone is composed of land parcels which have been made fully accessible to streets, roads and traditional central utilities. Land is used for residential, commercial, industrial, institutional, or organized
recreational purposes, with accompanying structures and landscaping. This is the "developed area," the "improved area," or the "urbanized area" of the United States
Census.
Development of any given parcel in the urbanized zone is made possible by external
improvements. Those are line improvements (streets, roads, and utilities) together with areal improvements (public and private buildings and landscaping) which raise the value of a given parcel but are located on competing parcels external to it. They raise the value of the given parcel by (a) increasing its accessibility to urban population and services and (b) reducing the number of previously undeveloped competing parcels remaining available for development. The increase in parcel value due to external improvements is often called the "unearned increment". Development of the given parcel also implies
internal improvements. These include line improvements (streets, utilities, walks, driveways) and areal improvements placed on the parcel, thus further increasing its value.
- The urban development frontier is the boundary of the urbanized zone. Only the Twin Cities urbanized zone is shown on Figure 2; of course there is a similar but smaller urban zone, with related features, at every major trade center outside the Twin Cities metropolitan area.
- 24 -
- The current land inventory for urban development includes land which is not developed but is for sale for non-farm development. It has come "onto the shelf" in the urban land market as a result of changes in its accessibility to the urbanized zone and accompanying changes in the priorities and attitudes of its
owners.
- The urban land value frontier marks the outer bound-ary of the current inventory for urban development. At any point on that frontier land values have begun to rise at a rate exceeding the general regional increase in rural land values, in response to the approach of the urban
development frontier (Figure 3, 4). Meanwhile, as those frontiers advance, rural land parcels are subdivided and converted to urban uses (Figure 5). On the map in Figure 2, the urban land development frontier for the Twin Cities is taken as the limit of one-hour driving time from the population center to the metropolis in 1980.
- The rural land supply with potential future urban use is generally neither developed, demanded, nor for sale for urban use now. But it is recognized in long-range plans as potentially in the urban market.
- The projected urban land value frontier marks the outer edge of the rural land supply with potential urban use. In Figure 2 it is taken as the outer boundary of the vast agglomeration of contiguous MCDs, surrounding the Twin Cities, which have experienced continuous
population growth since World War II. That is the zone of metropolitan influence - the realm of not only
long-distance commuters and second homes but also branch plants and industries oriented mainly to the metropolitan market or transportation facilities.
- The outer agricultural zone is the rural land supply used mainly for farming, beyond the projected urban land value frontier. On the map in Figure 2 this zone is taken as the combination of the Cultivation and Transition
regions.
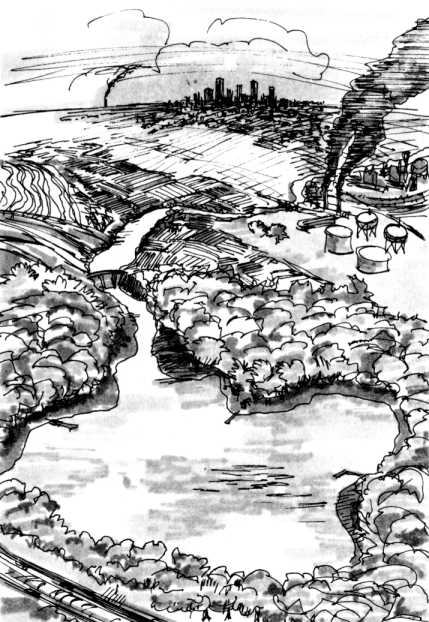
Figure 3. Graphic expressions of the Urban Development and Land Value frontiers.
- 25 -
Figure 4. Schematic illustration of the advance of successive urban frontiers during a period of expansion.
Figure 5. Schematic illustration of the conversion of a land parcel from rural to urban use during a period of urban expansion.
- 26 -
- The frontier of cultivation lies at the outer edge of the outer agricultural zone. In Figure 2 it is
represented by the boundary between the Transition and Forest regions.
- The Forest zone has been penetrated at only a few scattered places by crop agriculture and is generally used for logging or part-time farming and logging.
- The settlement frontier marks the boundary between utilized, inhabited forest country and wilderness. In Figure 2 that frontier is taken as the limits of the Boundary Waters Canoe Area (BWCA) - the wilderness section of the Superior National Forest.
- The natural zone remains unoccupied by any permanent settlement and in its natural state. In Figure 2 this is taken as the BWCA. In theory, and historically, the natural zone might be subject to potential future rural or urban uses. But in this case no such evolution is likely.
Thus the land use zones and frontiers are part of the structure of the land use system. They indicate the market status of the land within expanding (or contracting) fields of urban and agricultural influence. The land use map also indicates the current mix and pattern of land uses associated with each market status - the amount and variety of land subject to changing use as individuals and institutions pursue their goals in the market place (Table 8).
Table 8 - Amount of Land in Major Land Use Classes within Broad Market Status Zones of Minnesota (thousands of acres)
| Land Use |
One-Hour Drive
From Twin
Cities Center |
Remainder of
Zone of Contig-
uous Growth |
Remainder of
State |
Urbanized
Cultivated
Open/Pasture
Forest
Mines-Quarries
Water
Marsh |
420
1851
789
516
4
164
104 |
257
2681
1349
2145
4
484
163 |
571
19208
3860
15710
79
2642
1600 |
- 27 -
Previous Chapter Next
Chapter