![]()
![]()
![]()
![]()
![]()
![]()
![]()
![]()
![]()
![]()
![]()
![]()
|
|
|
(p. 165) Chapter 7 Reorganizing the Region's Work
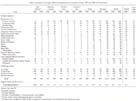
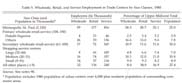
In 1929, employed people in the Upper Midwest numbered 2.3 million, or 37 percent of the total population. By 1980 the numbers had grown to 3.6 million, or 43 percent (Table 4). Throughout the years, employment, with population and income, was one of the most-used indicators of the changing material health of communities and regions. Changes in the description and location of jobs were part of the process of adaptation and transformation in the auto era.
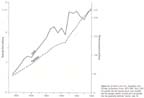
Jobs on the transportation and communication lines, on the farms, and in the mines, factories, trade, and service organizations are all parts of a vast productive system. Maps of circulation and settlement patterns are geographical diagrams of the system. And the purpose of the system is simply to enable people to work together to use the earth's resources and to enhance the quality of their lives. The system is unique because of its size and complexity — and because it is built from the inside by people who are a part of it. Hence, the productive system keeps evolving as part of a continuing quest for a better life, with both the inertia of human institutions and the uncertainty accompanying human curiosity and innovation. In that evolution, commitments and affections for places are always under review—continually tested by changes in the size, wealth, and functions of each community. The world market makes different demands on each place at different times, and the local people invent ways to meet the demands and even to change them. Thus employment keeps changing as the productive system evolves. A New National and Global Environment A host of new circumstances in the auto era demanded profound adjustments in Upper Midwest employment. The long-run decentralization of American population and industry from the historic Northeastern core region was accelerated toward the South and West. In that realignment, the region's share of the nation's industry and income increased, while its share of the population declined. But the biggest shifts went to other parts of the country, and the Upper Midwest had to adapt to the emergence of major new market opportunities and competition in both the Southeast and the Southwest. Meanwhile, it joined other American regions in coping with new international opportunities and competition. Improvements in transportation technology also promoted new job specialization and faster exchange of the nation's growing volume of goods, capital, and information. Waves of new products, services, and knowledge crashed incessantly across the marketplace, and with each wave came opportunities for new occupations and business firms. As a result, a continuous flow of entrepreneurs had to come into the marketplace to organize resources, labor, production, and distribution-to create organizations and jobs. Dun and Bradstreet counted a net increase nationwide of nearly one million new business firms from 1920 to 1980 (Figure 54). The increment was somewhat slower and much more unsteady than it had been before 1920. But the net growth figures masked a far more turbulent process of business formation, growth, decline, and demise. More than 9 million different firms were incorporated during that 60-year period, but only one million grew to even the very modest size and stability necessary for listing by Dun and Bradstreet. On the other hand, while millions merged, failed, or sold out, hundreds had phenomenal growth and moved up into the ranks of the 1,000 or so largest corporations in the country. Those newcomers, in turn, replaced big-time drop-outs. Of the nation's 1,300 largest corporations in 1920, only one-third were still intact 50 years later.76
Table 4. Breakdown of Upper Midwest Employment by Industry Group, 1929 and 1980 (In Thousands)
(p. 167)
Figure
54. Growth
in the U.S. Population and Number of Business Firms, 1875-1980. Since 1920 the
growth rate has become much more variable, and the average number of firms per
unit population has gradually declined. Source: note 76.
(p. 168)
Figure 55. Absorption of U.S. Labor Force Growth, 1960-1980. In those two decades, jobs had to be created for an unprecedented 37.3 million new entrants into the labor force. Source: note 77.
Entry of the post-World War II baby-boom generation into the labor force provided another example of the complexity of employment growth and change (Figure 55). In the 1960s and 1970s, jobs had to be created for 37.3 million new entrants into the American labor force. Never before had there been anything like that lump for the job market to swallow. Business firms created 20 million jobs, a little more than half the number needed. A million of those were in research and development working on new products to create still more organizations and occupations. Public agencies expanded to absorb another one-fifth. Fifteen percent-about one in every six-created their own jobs. They were self-employed. The remaining 10 percent were unemployed. Those groups, of course, were very dynamic. Uncounted hundreds of thousands of individuals shifted between private corporations, government, and self-employment. They were accounting for a substantial part of the job creation drama—the innovation, organization, spin-off, reorganization, growth, failure, merger. To be sure, ordinary population and market growth accounted for a large amount of employment increase within the framework of existing companies and public agencies. But the organizations that were largest, on the average, in 1960 provided less than their share of the new jobs. The greater share came from the growth of smaller firms and the creation of new ones.77
(p. 169) Americans also made some big changes in the nature and location of government employment. Amid fast-growing income and wealth, they raised the level of investment in every aspect of education in an effort to broaden the opportunities for their children in an increasingly sophisticated world. They committed governments to build and maintain a paved road and street system that links virtually every driveway with all others, and to build airports and improve waterways. Thus, the public took over construction and maintenance of way for the greater part of the transportation system. They also created a complex array of social insurance and subsidies in repeated efforts to gain security in a world of increasingly complex financial uncertainty. They supported a sevenfold increase in peacetime military employment in an effort to reduce their insecurity in a world of turbulent, and increasingly visible foreign contacts. Finally, they wanted more and better records and accounting of the changes in population, business, and government itself. Regional Adaptation The Upper Midwest did adapt to these dramatic auto-era changes in its environment. Growth in nonfarm employment not only compensated for the 600,000 lost farm jobs but added another 1.2 million in the bargain (Figure 56). Manufacturing employment doubled as a result of both decentralization and development of new products. The number of construction jobs nearly doubled, despite slowed population growth, in response to the region's growing wealth and capital improvements. Retail and wholesale trade employment more than doubled, and service employment tripled, reflecting the nationwide specialization and acceleration of exchange.
Transportation employment declined slightly. Thousands of railroad jobs fell victim to greater efficiency and private auto competition, but thousands of new jobs appeared in trucking, airlines, and utilities. Employment dropped much more in the mineral industries, but it also shifted from the troubled iron and copper ranges to Great Plains oil and coal fields. A remarkable Upper Midwest seedbed and crop of entrepreneurs invented ways to serve not only the regional market but also distant national and world markets. They expanded older firms and started new ones. They created jobs that otherwise would not have been here and income that otherwise would not have come here.
Government employment increased fourfold in 50 years, from 150,000 to nearly 600,000. The share of all Upper Midwest jobs on public payrolls grew from an estimated 7 percent to 17 percent. The public sector accounted for nearly half of the increase in service and transportation and utilities employment. The Upper Midwest was often in the vanguard of government programs in education, transportation, and welfare —perhaps because relatively homogeneous culture and comparatively rapid economic growth made it easier for state populations to act as communities.
Employment adaptation varied from one part of the region to another. Gains and losses were in different locations. The Twin Cities and the other major clusters of urban growth gained 1.4 million nonfarm jobs between 1929 and 1980, while they lost about 200,000 farm jobs from the suburbanization or consolidation of farms —seven nonfarm jobs gained for every one farm job lost. In contrast, in the mining districts 41,000 jobs were added in the services and trade, but 40,000 were lost in mining and related industries. With the help of manufacturing expansion in many medium-sized cities, nonfarm growth more than offset the loss of 123,000 farm jobs in the Corn Belt. Mainly because of increases in the recreation and paper industries, nonfarm employment growth slightly exceeded the loss of jobs through farm abandonment in the northern forest areas. But in the semiarid and subhumid Great Plains, out-migration and farm consolidation were very large, and urban centers were few and widely dispersed. As a result, nonfarm job growth was scarcely half as large as farm job loss.78 The Surviving Farm Jobs Farm households decreased from more than one-half million to about one-quarter million in the auto era. Total employment, including hired hands, dropped from 951,000 in 1929 to 364,000 in 1980. The 1980 total included about 250,000 farm operators and a little more than 100,000 other farm family members and hired workers. A small fraction—perhaps 2 percent—of the hired workers were seasonal immigrants.
The farmers who remained after a half-century of transformation were vastly more highly capitalized and productive than their predecessors two generations earlier. Value of farmland and buildings in 1982 was nine times the inflated post-World War I figures of 1920, 10 times the depressed values of the mid-19208. The change reflected the mushrooming in the 1950s through the 1970s of new buildings for livestock, grain and equipment storage, large machinery, cars and trucks, as well as pens, fencing, tanks, drainage or irrigation works, and new or enlarged and improved housing. In the region's cropland corridor from western Wisconsin and northern Iowa to northern Montana, land and buildings on the average fulltime farm were valued at around half a million dollars in 1982. In addition, the average place had $75,000 to $100,000 worth of equipment and machinery. That equaled the value of crops and livestock sold from the average fulltime farm in the preceding year (See Figure 42, Figure 43). The investment in land, buildings, and machinery per farm worker was about $390,000! But two-thirds of the workers were also owners, managers, and executives of their own enterprises.
(p. 170)
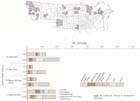
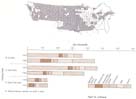
Figure 56. Changes in Employment, 1929-1980. (4 pages) The bar graphs dramatize the overall employment growth and shift from farming to service, trade, and manufacturing in the auto era. The graphs also point up contrasts and similarities between the different urban clusters and outlying areas identified on the maps. Source: note 78.
(p. 171)
Figure 56, continued.
(p. 172)
Figure 56, continued. Changes in Employment, 1929-1980
(p. 173)
Figure 56, continued.
(p. 174)
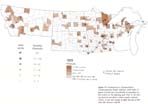
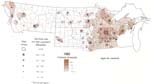
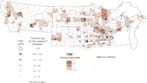
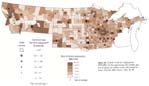
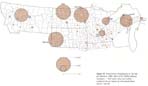
With its enormous gross earnings and heavy capital outlays, farm employment continued to undergird a major share of the Upper Midwest economy. In North and South Dakota, Minnesota, and eastern Montana, 70 percent to 80 percent of the economy depended ultimately on the handling and processing of farm products for export to the rest of the nation and world. In the region as a whole, the economy depended perhaps one-third on agriculture, in the Twin Cities, perhaps 15 per-cent.79 Yet the 1980s saw growing concern about the future of agricultural employment. The industry depended increasingly on grain exports in the international markets. Earnings were becoming more variable and uncertain. Competition was increasing from other regions of the developed world and from some developing countries. Need for the region's bulging output of grain, meat, and dairy products was still high in many overpopulated, underfed areas of the world, but shipments to those areas generally required American subsidies, and there was always uncertainty about future public support. Farms continued to grow in average size, with an accompanying reduction in the number of fulltime farms and farm jobs. As a result, both rural and urban people felt uneasy about the outlook for family-owned, family-operated farms. Family farms were believed to be the hearth and bastion of basic values in the society of America in general and of the Heartland in particular. Sheer reduction in the number of farms was threat enough. But beyond that, to many observers increasing size and capitalization pointed toward an inevitable shift away from owner-occupants toward absentee ownership and control by large business organizations. The fears were aggravated during periods of financial adversity. While the family farms had developed a mythos, they had also played a major, real part in shaping the remarkable transformation of the Upper Midwest in the automobile era. To be sure, the changes in that era had greatly increased the farmers' productivity and their participation in the world's system of specialization and exchange. The resulting increase in gross farm income would have occurred in any case. But the decentralized, local ownership and control of the industry meant that the flow of earnings, expenditures, and savings would be channeled and revolved through the local communities to a much greater extent than would have been probable with more centralized, absentee control, at that stage in American development. On the resource side, soil management practices were probably better than they would have been otherwise, because the majority of owners expected to remain on their land and pass it along to successive generations. In fact, the region's family farms, with those of the nation as a whole, appeared to be diverging from the historic norm along two different lines: industrialization and urbanization. Neither trend was new. Both had been running throughout the auto era. On the one hand, farming had become ever more industrial in character—bigger fields, more land, more and bigger machines, more modification of the natural resource through drainage, irrigation, and chemicals. The industrializing units tended to be owned and run by operators who earned most or all of their income from farming. While most still lived on their farms, a significant number of "sidewalk farmers" lived during much of the year in a nearby urban trade center for greater convenience to schools and other services. The number of these fulltime farms dropped by 59 percent from the 1920s to the 1980s. On the other hand, farming had also become more urban in character. Not only had many farm tasks shifted to the towns; but also growing numbers of farm operators were earning more than half of their income from nonfarm employment (See Map 41). The number of those part-time farmers actually increased about 10 percent between the 1920s and 1980s. The trend reflected the greater accessibility of farming areas to jobs in the towns and cities. It offered an opportunity for increased income as well as increased stability from diversification. The average part-time farmer's total net income, including off-farm earnings, was more than that of the average fulltime operator. The opportunity to diversify reached both ways. It appealed to farm families with skills that were marketable off the farm, and it appealed to urban workers and their families who wanted to live in the countryside and employ their farming skills. The urban occupations of both groups ranged from laborer to business proprietor to professional. For example, small farmers became factory workers or independent technicians in the towns; urban computer programmers and auto mechanics bought small farms and worked them evenings and weekends. A prosperous farm family might buy an automobile dealership, and a prosperous auto dealer might buy a farm. For what it was worth, many values of the idealized family farm appeared alive and well in the statistical profile of the average part-time farm: self-reliance, large families, children participating in farm work and growing up in the open country.
(p. 175)
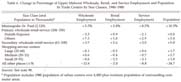
Part-time farming was growing mainly within commuting range of the region's main urban employment clusters and in the lake and mountain regions. By 1982 the operators who earned most of their living off the farm accounted for one-fourth of the region's farms, 9 percent of the value of land, buildings, and machines, and about 7 percent of the value of farm products sold. Thus, the part-time farms averaged about one-third the size of the fulltime operations. No near, practical limit to the urbanizing trend in agriculture could be foreseen. Much more farmland could shift into the part-time category if necessary. And the trend seemed to pose no clear threat to the family farm as a social institution. However, the need persisted to adopt large-scale industrialization of fulltime farms yet somehow to maintain family ownership and occupance, decentralized management and control. Thus, the number and character of jobs in the region's most important basic industry depended on creative organization and entrepreneurship. Trading New Jobs for Old in the Circulation System Despite the transportation and communications explosion, the number of workers operating the Upper Midwest transportation, communications, and utilities systems changed hardly at all from 1929 to 1980 (Figure 57). There was a net decline of 2.5 percent, from 159,000 to 154,000. But beneath the calm statistical surface a metamorphosis occurred.80
At hundreds of small and medium-size cities, towns, and hamlets the transformation was gradual and simple. The railroad station agents and the operators of horse-drawn drayage and livery services disappeared. The local truckers graduated from four-wheelers to 18-wheelers and extended their range from the neighboring towns to the neighboring states. Operation and maintenance of the growing electric and phone utilities compensated for jobs lost in railroading. Most of the compensating jobs tended to locate at the county seat, no matter where in the county they had been earlier. Thus, despite many internal changes, the net loss of transportation and utilities jobs was small in most counties. In fact, in 289 of the region's 342 counties, with 54,000 transportation and utility jobs in 1980, there had been a net loss of only 4,000 in the half-century since 1929. A similar substitution of new occupations for old took place in some larger centers. The main rail lines operated sprawling yards and shops at La Crosse, Eau Claire, Mason City, Minot, Grand Forks, Aberdeen, and Great Falls. The confluence of rail lines had given those places much of their momentum in the first place. Now, employment growth in trucking and utilities roughly offset the sharp decline in railroading. Total transportation and utilities employment in those seven cities was about 11,000 in 1929, and it still stood at 10,000 fifty years later. But the changes were dramatic in a few places. In the Twin Cities and nine new, fast-growing outlying metropolitan areas, transportation and utility employment rose 12 percentage points, from 33 percent of the Upper Midwest total to 45 percent. At the same time, the iron and copper country and highly specialized railroad towns dropped 12 points, from 24 percent of the total to 12. In those cases, too, jobs gained equaled jobs lost. But the gains and losses were located hundreds of miles apart. In the iron- and copper-mining districts and the Great Lakes ore-shipping ports, employment on trains, docks, and tugs was lost because of larger and faster equipment. Mine and ore dock shutdowns added to the losses. Counteracting growth occurred in trucking and utilities, but it was mainly in the larger centers of population and wholesaling: Duluth-Superior, the Mesabi Range cities, and to a much smaller extent Butte and Marquette. Overall gains compensated for no more than one-third of the losses.
Declines also greatly exceeded gains in the small cities and towns at railroad division points. Those were the places where a single main line broadened to form a swath of 10 or 20 parallel sidetracks that spread over as much land as the town itself. In the 1920s, at those points through trains changed crews, locals originated and terminated, and equipment was serviced. An oversized two-story station housed a cadre of clerks and dispatchers who monitored and directed traffic over a hundred miles or more, by telegraph and handwritten orders. Many of the workers lived in the town, but many of the crews were transient. A two-or three-story hotel near the depot dominated the Main Street facade. Night and day, winter and summer, crewmen crossed the polished lobby floor, paused at the brass cuspidors and tobacco stand, and headed upstairs for some sleep before the next run. (p. 176)
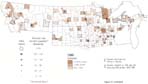
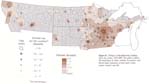
Figure 57. Employment in Transportation-Communications-Public Utilities, 1929-1980. (2 pages) Growth was concentrated at important urban centers on the highway grid. But, in the mining districts and about a dozen smaller railroad centers, it was not enough to offset the loss of railroad jobs. Source: note 80.
(p. 177)
Figure 57, continued.
(p. 178) On
the 1929 map, 24 of those towns were strung along the transcontinental corridor
and along the prairie and North Woods lines from Chicago.
They lost nearly half of their 1929 transportation
employment by 1980. Strong railroad
activity continued at Glendive, Montana,
and strong growth of trucking went on at a
few other places in the group. But the strength
of those places fell far short of compensating
for the collapse of railroading at Oel-wein
and Cherokee in Iowa, Huron and Mo-bridge
in South Dakota, Miles City and Three Forks
in Montana, Tracy and Staples in Minnesota,
and perhaps a dozen more towns. Of course, the main lines were far from dead. Only the labor force and trackage were cut back. Trackside offices, though smaller, were new or refurbished. Modern electronic communication helped to control traffic over longer segments of line. Hundred-car trains sped between more widely separated, automated yards. Their specialized cars were loaded with long-haul cargo: Upper Midwest grain for Duluth, Gulf, or Pacific ports; Montana coal for the Midwest; Pacific Northwest building materials for the Manufacturing Belt; Manufacturing Belt machinery and automobiles headed west; Japanese automobiles headed east; overseas containers en route from Japan to Europe or from Taiwan to Chicago — and countless other examples of national and international exchange. The locals and the passenger trains were only memories. But fewer, far longer, and heavier trains hauled a greatly increased tonnage as they rumbled through rusty yards on upgraded main tracks. Seven of the nine fast-growing new metropolitan areas—St. Cloud, Sioux Falls, Fargo-Moorhead, Bismarck-Mandan, Billings, and Missoula —had also been important rail centers. But their smoky yards, roundhouses, and shops were replaced —in other parts of the city—by modern, even more extensive, but equally utilitarian steel truck terminals and blacktop parking lots. In bright but simple new offices, both at the truck terminals and track-side, the ratchet sound of computer printers had replaced the clacking depot telegraphs. Air-conditioning, cable TV, and banks of vending machines in the truckers' caravansaries replaced the stale-air austerity of the trainmen's hotels. The Twin Cities were the scene of the biggest transformation. Within today's seven-county metropolitan area, the number of transportation and utilities jobs increased from 27,000 in 1929 to 34,000 in 1980. While thousands of jobs were lost in the railroad corridors through the central cities, nearly 2,000 railroad corporate office jobs remained in the downtowns. The airport, with its terminals, major overhaul bases, and airline corporate headquarters, accounted for more than 10,000 new jobs. Trucking companies spawned thousands of new jobs in the central wholesale districts and the Midway, then shifted and expanded into the suburbs. With the development of the Upper Mississippi River locks and dams and the stable nine-foot channel in the 1930s, commercial navigation revived; and the resulting new barge and towboat jobs concentrated at the port of St. Paul. Employment in communication and electric utilities grew with the metropolitan population, reinforced by central offices at the focus of the regional communication network. By 1980, transportation and utilities employment was concentrated more than ever in the Twin Cities, and the concentration had increased strongly in the fast-growing, smaller metropolitan areas as well. Meanwhile, the transportation and utilities share of employment in all cities showed different patterns: it was about steady in the Twin Cities, while it rose sharply in the fast-growing smaller metropolitan areas and in scores of small cities and towns. The Twin Cities were shifting increasingly to capital-intensive components of the circulation system: air transport, electronic communications, long-haul freight. The smaller cities involved in shipping goods were doing more of the labor-intensive trucking: shorter hauls, smaller shipments, general cargo. As a result of decentralized trucking operations, most of the trade centers outside of the Twin Cities became more specialized in hauling the region's goods than their counterparts had been a half-century earlier. In fact, the number of places dependent on trucking for their living was greater than the number dependent on railroading in 1929; moreover, the dependency on trucking was greater than that on railroading had been. As a symbol of the livelihood of those places, the semi had replaced and surpassed the boxcar. Shrinking and Unstable Employment in the Mineral Industries From the 1920s to 1980, the total number of jobs in the mineral industries declined from over 50,000 to 24,000. Most jobs had always been located in just a few distinctive parts of the region-a few unique natural resource concentrations rich enough and big enough to appear on world maps. To be sure, the sand, gravel, and crushed-rock industries employed several thousand people in the production of construction aggregate at hundreds of widely scattered deposits. More localized were the quarries supplying the region's three cement plants, several brick and tile works, and the parent plant of the country's major producer of granite building-stone at Cold Spring, Minnesota, near St. Cloud. Except for several hundred employees in the granite quarries, those jobs were an integral part of the construction industry within the region. In contrast, the metallic ore and mineral fuel industries in the 1980s were more than ever parts of worldwide industries centered outside the Upper Midwest.81
(p. 179)
Major
metallic ore deposits are clustered in the Montana Rockies, the northern Black Hills,
and the Canadian Shield. The richest have
been the copper deposits of the Butte district
in Montana and the Keweenaw Peninsula in
northern Michigan, and the iron ores of the ranges
around Lake Superior. The most important
coal and oil deposits are in the massive accumulation
of layered sedimentary rocks that
underlie the semiarid Great Plains from the
Missouri River in North Dakota to the eastern
base of the Rockies in Montana. Between the 1920s and 1980, copper, iron, and gold mining lost 33,000 jobs, while coal, oil, and gas gained 6,000. Sharp, temporary booms and recessions sometimes obscured the long-term trends. LONG-TERM
DECLINES Copper-mining
employment at Butte and the
Copper Range locations declined from 18,000
in the 1920s to zero in 1980. The problems
were declining quality and increasing depth
of the ore, together with competition from
foreign areas with comparable or better ore
and a fraction of the labor costs. Most of the change
came during the Great Depression of the
1930s. After World War II, there was a shift to
open-pit mining at Butte in an effort to cut costs
by taking advantage of the great gains in size
and efficiency of earth-moving machinery.
But that was still not enough in the long run, as world copper prices kept
falling. By 1980 a few
hundred jobs remained in the White
Pine copper mine and smelter at the eastern
base of Michigan's Porcupine Mountains,
but those jobs also appeared to be threatened. Iron-mining employment fell from 30,000 to 15,000 between 1920 and 1980. The industry retreated from the smaller, less accessible deep deposits, even though they were high-grade. As a result, employment of the Gogebic and Menominee ranges —centered on Iron-wood, Iron River, and Iron Mountain, Michigan-fell from 6,000 to zero. Production was consolidated on the large, shallow ore bodies and open-pit operations, although those ores were lower in average quality. By the 1970s, 95 percent of the production came from Minnesota's Mesabi Range, the remainder from the Marquette Range in northern Michigan (Figure 58). In both cases the industry opened new, highly mechanized mines and invested heavily in very large-scale plants to crush, grind, and pelletize the low-grade ores. The first of the mammoth plants, at Silver Bay on Lake Superior's north shore, was named f or E. W. Davis, University of Minnesota engineering professor who spent his professional life in development of the process. The pellets provided a standard, high-quality feed for the iron and steel furnaces on the southern edge of the Great Lakes and in the Ohio Valley. In 1980 dollars, the plants represented an outlay of 3 to 4 billion—more money than all but the largest steel company could raise alone. Some of the nation's biggest corporations found themselves burying longstanding rivalries in favor of joint venture, to borrow hundreds of millions for construction and equipment. As a result of the change from natural ore to pellets, less tonnage had to be shipped down the lakes, and the average quality rose from around 50 percent iron to 62 percent. There had been a strong case for investment in pellet plants. The substitution of capital for labor would shift from a larger number of unskilled jobs to a smaller, but it was hoped, more stable, number of higher-paying, more skilled jobs — the end of pick-and-shovel work, the beginning of more operation and maintenance of complex plant and equipment. When the plants were planned and initiated, Cold War psychology was especially pervasive. In contrast with rejuvenated Cold War thinking in the 1980s, greater emphasis then fell on national self-sufficiency. There was no question about the importance of self-sufficiency in iron and steel. The demands of World War II had seriously depleted reserves of high-grade natural ore. But vast reserves of low-grade ore, suitable for pelletizing, would last at least one or two centuries. Everyone concerned agreed that the investment should be made. The steel industry could behave differently from the copper industry because it seemed to be less vulnerable to world competition. The iron-ore resources near Lake Superior were among the richest and largest known in the world. The coal resources of the Appalachians, not far from the southern shores of Lake Erie, were —and are —the world's largest high-quality reserves for metallurgical purposes. Between the two lay the natural waterway of the Great Lakes. And the southern part of that extraordinary natural complex lay in the path of expansion westward from the Middle Atlantic Seaboard. The result was a combination of market accessibility and naturally endowed production efficiency that was overwhelming. The southern Great Lakes region had emerged quickly in the late nineteenth century as the dominant center of steel and heavy machinery fabrication in the western hemisphere. A regional oligopoly developed which included finance, management, and labor— protected by seemingly unassailable natural advantages. Not until the 1970s was a challenge visible. The quality of overseas machinery products had become high enough, while labor costs had remained low enough, that the Great Lakes area's natural endowment alone could no longer provide the competitive edge. At the same time, the uncertain price and supply of oil had conspired with foreign styling to squeeze Americans into smaller, lighter cars with a greatly reduced steel content. Growth in the South and West had changed the market position of the Great Lakes region. A potential flood of high-quality natural foreign ore from the tropics was waiting for new steel mill construction in tidewater locations to open wide the American market. Now everyone agreed the Great Lakes region was in big trouble. But by that time the pelletizing plants were built, and so were the homes and communities of the workers to run them.82 (p. 180)
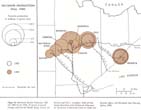
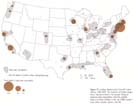
Figure 58. Minnesota Taconite Production, 1965 and 1980. By the 1970s, 95 percent of taconite tonnage came from the Mesabi Range. Source: J.R. Borchert and Neil C. Gustafson, Atlas of Minnesota Resources and Settlement (Minneapolis: University of Minnesota Center for Urban and Regional Affairs, and Minnesota State Planning Agency, 1980).
(p. 181)
Black Hills gold-mining employment has been operating in a still different world environment. The Homestake, at Lead, South Dakota, is America's largest gold mine. The federal treasury has provided a stable market and floor price for its product, although profits have fluctuated with the effects of depression, inflation, and the rocketing in the 1970s of the world price of gold. The labor force has remained quasi-constant in the neighborhood of 2,500 for the past half-century, while the shafts have gradually gone more than a mile deep, and the honeycomb of tunnels has kept expanding.
OFFSETTING GAINS
While
ore mining declined overall, the giant
American fuel mineral industry expanded in
the Upper Midwest part of the northern Great
Plains. Montana oil and gas production began
early in the auto era in the Shelby-Cut Bank
area along the Great Northern High Line east
of the Rockies, near Baker in the eastern part of the state, near the Wyoming
boundary southwest of
Billings, and in the Cat Creek district
in the center. In fact, when Jack Dempsey defended
his world title in 1923, he boxed not in New York but in the unlikely location
of Shelby, Montana—a small farm trade center then in the midst of a
free-spending oil boom. With deeper drilling, improved exploration science, and ever-increasing demand, those early fields were extended, especially after World War II. But the most important developments of the 1940s and 1950s came in the Williston area of northwestern North Dakota. Another burst of exploration and drilling followed the oil shortages and price increases in the mid-1970s. Employment in the oil and gas fields rose from virtually zero to a census figure of more than 4,000 in 1980—perhaps two to three times that many, if all of the directly related business and production services were added. Upper Midwest oil production was about 2 percent of the nation's total.
Long before the oil rigs came to the northern Great Plains, railroads and a few small local companies-and even a few farmers and ranchers—were digging coal and lignite. Immigrant laborers worked the bituminous coal deposits near Roundup, Red Lodge, Great Falls, and a few other locations in Montana, and the lignite deposits at Beulah, in North Dakota's Knife River Valley. Altogether no more than 900 paid employees worked in the widely scattered mines.
By 1980 the number of employees was nearing 3,000 and rising. The old underground mines were all closed. A comparatively small number of miners, working open pits with gigantic excavation and conveyor equipment, were producing between 5 and 10 percent of the nation's coal. There had been major expansion of lignite production in western North Dakota's Knife Valley to supply a half-dozen large, immediately adjacent thermal-electric plants on the regional power grid, as well as a federally subsidized, $2-billion gasification plant to produce synthetic fuel for new pipelines to Chicago and Detroit. More electric power and hydrocarbon conversion plants were planned although soft prices on the world oil market made all plans tentative. Extensive new strip mines had been opened on the low-sulfur bituminous coal deposits in eastern Montana. The major operations were at Colstrip, south west of Miles City, and Decker, southeast of Billings in the Tongue River Basin. The thick seams extend beneath picturesque ranching country and lands of the Cheyenne and Crow Indians. Both centers are less than 50 miles and little more than a century removed from the Custer battlefield. About one-tenth of the coal produced in 1980 was burned at two large generating stations at Colstrip. But unit trains carried the great bulk of the output to power plants in major Midwest markets, where it was mixed with high-sulfur Ohio valley and northern Illinois coal to meet air quality requirements. The largest flow moved from Colstrip to the historic transcontinental Northern Pacific line in the Yellowstone Valley at Forsyth, Montana, then eastward. Unit trains hauled about 1,500 carloads daily into Minnesota, two-thirds for in-state power generation, most of the remainder for shipment from Duluth-Superior down the Great Lakes.
(p. 182) SHORT-TERM UPS AND DOWNS
Short-term instability was just as striking as long-term decline. Metallic ore-mining employment has risen and fallen with production and demand. On the Mesabi, for example, average yearly production nearly doubled during World War I, fell back 20 percent at the end of the war, rose 25 percent at the peak of the 1920s boom, dropped nearly 70 percent in the worst years of the Great Depression, rose 500 percent during World War II, dropped 20 percent after the Korean War in the late 1950s, rose 11 percent to the peak taconite pellet production year in 1979, and fell 50 percent by 1983 in the face of recession and the auto-making crisis. Thus, in the early 1950s the mines were working overtime to feed Korean War and Cold War demands piled on top of the suburban growth boom. Managers invented a three-day, 40-hour shift to make it possible to draw commuting labor from farm and forest areas as far away as 200 miles. Commuters shared makeshift sleeping rooms on the Mesabi, attended to affairs back home on four-day weekends. Contrast that with the early 1980s. Then hundreds of unemployed tradesmen from the mines worked on construction projects as far away as the North Dakota lignite fields and commuted back to their Mesabi Range homes and families on weekends. At the Beulah gasification plant construction site, they shared barracks with skilled workers laid-off from southern Michigan's automobile factories, in a symbolic display of the problems of the Great Lakes economic complex and both groups' close linkage within it. The ups and downs have been dramatic indeed. Meanwhile, Mesabi production has shifted from one part of the district to another as older mines were exhausted and new ones opened (Figure 59). That process began very early in the history of the Iron Range. While production locations were shifting, workers were buying homes and settling down. Increasing numbers of miners were reluctant or unable to move as the jobs moved from one location to another. As population and income grew, shopping and recreation facilities expanded at the larger urban centers, especially Ribbing and Virginia. There was more and more need for mobility along the axis of the Iron Range. At the beginning of the automotive boom around 1920, a Boston-backed electric interurban streetcar line was already 13 years in operation. The locally backed corporate embryo of the Greyhound Bus Company was four years old and destined to drive the trolley line out of business within a decade. By 1980 the electric railway was hardly even a memory. Greyhound was a nationwide bus operation and nucleus of a multi-billion-dollar conglomerate based in Phoenix, Arizona. And the state of Minnesota had built —with high priority and federal aid-an expressway to facilitate the still greater number of commuting and shopping and recreation trips along the length of the Iron Range.83
Short-term
instability was also a feature in other
districts and other sectors of the mineral industry.
When they operated, the copper ranges
had experienced similar fluctuations in overall
employment, internal shifts in job locations
and work trips, and a similar streetcar line running
much of the length of the Range. Employment
in oil and gas boomed with initial discovery
in each field and again with the flurry of activity during the energy crisis of
the 1970s. It declined
after development in each field and again
with the weakening of world oil prices and
the slowed growth of American energy consumption
in the 1980s. The gold mines have
experienced less short-term instability, along
with their smaller long-term changes. The
price of their product was supported after 1933;
and gold is really a deeply ingrained social
institution, while iron and copper are mere economic
necessities. Only a temporary order by
the War Production Board during World War
II seriously interrupted the steady flow of precious
metal and the steady penetration of shafts
and tunnels into the bowels of the Black Hills
beneath Lead, South Dakota.
Employment
trends during the auto era in the mineral industries of the region have been complicated.
Different production centers are widely
dispersed. Ore production has differed from
fuel production. Copper trends have differed
from iron, and both have differed from gold. Open-pit operations have differed from
underground. The Great Plains have differed from the Shield and the
mountains. Timing and technology have been
different.
But the various places have also had important features in common. Each has been almost inflexibly specialized in the production of a single commodity. Each has experienced long and continuous substitution of capital for labor. Although each production center is part of the Upper Midwest service and distribution network, its basic function has always been integral to a separate, far-flung, specialized industrial complex. All of the places are in sparsely populated parts of the region. There have been no ready local substitutes for jobs lost in mining. The mineral industries are ex-ploitive. The resources they recover are non-renewable. In the communities, the sense of permanence has been diluted with uncertainty about how long the resources might last in both the earth and the marketplace. The result has been a half-century of fluctuating and fitful overall employment decline amid some of the world's most awesome industrial landscapes.
(p. 183)
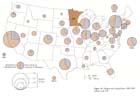
Figure 59. Mesabi-Vermillion Ranges: Populations and Ore Shipments, 1905 and 1960. In 1905 the Mesabi Range was in its initial boom period. By 1960 mining had spread the full length of the Range. The post-World War II boom was still running, and taconite production was booming at the eastern end of the Mesabi. Source: Borchert and Gustafson, Atlas of Minnesota Resources and Settlement, 1980.
(p. 184) Expansion and Change in Manufacturing While
auto-era changes in farming, mining,
and railroading illustrate how jobs were lost,
manufacturing changes begin to show how
the jobs were gained. Upper Midwest manufacturing
employment increased from 272,000
in 1929 to 554,000 in 1980- about 6 percent
above the national growth rate.
The growth was part of a national decentralization from the American Manufacturing Belt to the rest of the country. But it was different from the shift to most of the South and West. Industrial growth in those two regions accompanied major growth in their share of the nation's population, and a great deal of it came from establishment of branch plants from other regions. In contrast, the Upper Midwest's share of national population dropped, from nearly 5 percent to 3.1 percent. Despite that decline, the region's share of manufacturing employment rose slightly, and almost all the growth was generated by local entrepreneurs and locally based companies. The exceptional performance was not the result of traditional locational advantages. To be sure, the region did embrace 10 percent of the nation's market for farm supplies and equipment, but it remained well removed from even that market's center of gravity in Illinois. Average production wages were below those in the heart of the Manufacturing Belt but above much of the rest of the country, especially the South. Regional energy resources were significant but remote and still small in comparison with the major producers.84
Thus Upper Midwest growth had to come from unusual development in two fields. One possibility was export industries which did not depend on cheap labor, cheap local energy resources, or low-cost transportation to major national markets. The other was substitution for products otherwise imported from national manufacturers within the limited regional market.
THE 1920s: LEGACY AND PROSPECT Manufacturing employment in the 1920s was mostly in the Twin Cities, the region's oldest agricultural areas in central and southern Minnesota and north-central Wisconsin, and the Lake Superior cutover and mining district (See Figure 60). The cutover district had a legacy of lumber milling at major waterpower and port cities, and smelters still operated on the Copper Range. Small metal-working industries supplied parts and equipment for the loggers, sawmills, and mines. World War I defense contracts had stretched the lives of some plants, but with the depletion of the forest, most of the complex was in decline. Duluth was an important exception; it was holding steady. With a relatively large, stable labor force, the district's largest city and port had a million-ton steel mill that supplied wire and posts to fence the agricultural hinterland and blast furnaces that supplied iron to Upper Midwest foundries. The region's largest horseshoe factory was converting to production of handtools. Other plants were established producers of shipboard and dock gear for the Great Lakes, and there was an array of small printing, food, and garment industries. Other exceptions to the general decline were the major waterpower sites and lumber-shipping ports, where some of the region's largest sawmills had converted to pulp and paper to use second-growth timber. In contrast with the northern forest area, the older, eastern part of the Corn Belt and the dairying areas on the forest fringe contained important urban seedbeds for new industrial growth. The main centers were at historically important, small waterpower sites and intersections in the regional rail grid. At those locations, flour mills, large creameries, and breweries were legacies from pioneer settlement, and meat packing had become well established by the twentieth century. Vegetable canning was already in its second decade in the Minnesota River Valley, where the jolly Green Giant had become an established resident. Small and moderate-sized plants that served the regional market turned out machinery, harness, belting, chains, and many other farm supplies. Brick, tile, and cement came from the well-established regional center at Mason City, tile and nationally famous pottery from what had been a pioneer crockery and tile works at Red Wing, Minnesota. In the larger centers a few companies were beginning to diversify, and others had specialized for the national market. Notable firms produced machinery, auto parts and tires, and rubber apparel. Their plants dominated the industrial districts of Eau Claire, LaCrosse, Wausau, and even as far west as St. Cloud, where an electrical equipment manufacturer had occupied most of the ill-fated Pan Motor Company's sprawling auto manufacturing complex. Paper mills had replaced the much older sawmilling industries on the northern forest fringe of the Dairy Belt, along the upper Mississippi above St. Cloud, the Chippewa River at Eau Claire and northward, and the Wisconsin River from Wausau to Rhinelander. They could take advantage of both waterpower and the labor of European immigrant stock leaving marginal farms by the thousands.
(p. 185) The whole range of industries came together at the region's metropolis and primary market. The Minneapolis flour-milling industry had been the established leader. But it had begun to decline in the 1920s as a result of the loss of its preferential freight rates and competition from the hard winter wheat region of the southern Great Plains—from Kansas to the Texas panhandle. General Mills, newly formed from one of the great industrial mergers of that time, Pillsbury, and a few others were not only emerging as dominant companies but also embarking on nationwide programs of acquisition and innovative marketing. All-American housewife Betty Crocker and all-American boy Jack Armstrong, selling Upper Midwest cake mix and breakfast food, were pioneer advertising creations on the newly organized coast-to-coast radio networks. While milling headquarters were growing in Minneapolis, production was expanding elsewhere. The Twin Cities had the region's largest meat-packing plants, breweries, and millwork companies. There were large manufacturers of tractors, threshers, plows, and a great variety of farm hardware and supplies. The "Minneapolis" automobile was stillborn, but large-scale assembly of Fords had just moved in 1925 from a multisto-ried plant in Minneapolis to a much larger ultramodern industrial park in St. Paul. Twin Cities entrepreneurs had been among the first in the nation to see the possibilities of both central heating and electrical energy. The Minneapolis Heat Regulator Company had joined forces with an Indiana competitor named Honeywell. Franklin and Seeger were making mechanical refrigerators; although the big, absentee-owned Mazda Lamp plant had just closed. The Minnesota Mining and Manufacturing Company (3M) was beginning to diversify from its booming sandpaper business. In addition, hundreds of small shops were supplying the larger plants, the growing regional business services, and the regional market for consumer products: drugs and cosmetics; boots and shoes; apparel; printing and publishing of regional trade journals, religious books, calendars, playing cards. The shoe and apparel industries had suffered the loss of western markets after the completion of the Panama Canal, but the religious publications market was beginning to follow the swelling stream of Upper Midwest migrants to Pacific Coast states. Brown and Bigelow were building up the remarkable calendar sales force for international marketing of the products from their newly built lithography park in the Midway district. More than 100,000 manufacturing employees worked in the Twin Cities complex. It was a bustling mixture of legacies and newcomers. Yet its largest industry, flour milling, was reorganizing in the face of apparent decline, and all were about to face the test of the Great Depression.85 Industrial jobs were few and widely scattered in the rest of the region. The cities and towns of the western Corn Belt and Great Plains were creatures of the steel rail era. While the railroads brought settlement and trade, they did not bring the kind of local manufacturing growth that had accompanied the westward movement of the frontier up to the 1870s. Instead, with improved long-haul speed and capacity, they simply enlarged the hinterlands already served from the established centers, especially Chicago and the Twin Cities. The western cities were busy centers of distribution with little export manufacturing. To be sure, there were small, ubiquitous industries at all the wholesale-retail centers to serve their local territories: feed and flour mills, bakeries, meat packers, leather-goods makers, candy factories, and a host of others. Some grew large enough to go to the regional or national market— notably the grain and meat processors and a few beet sugar mills operating on the irrigated oases along the Yellowstone and Belle Fourche rivers. Additional important industries appeared on the scene in the mountain valleys of Montana and the Black Hills: the mammoth Anaconda smelting and refining facilities at Butte, Anaconda, and Great Falls; lumber mills in the Flathead-Bitterroot trench, and the Home-stake mining and lumbering interests around Deadwood and Lead, South Dakota. FIFTY YEARS OF ENTREPRENEURSHIP AND ADAPTATION
By 1980 the picture had changed dramatically (Figures 60-61). The greatest absolute growth occurred at the Twin Cities, where the central and suburban counties had a quarter-million manufacturing jobs, compared with 100,000 a half-century earlier. Their share of the Upper Midwest total had risen slightly, from 37 percent to 41 percent. However, the big net gain masked some losses and substitutions. Only four flour mills were still running. Only one —that in the far outer suburbs—had been enlarged since 1920. The tractor and harvester plants had been sold, closed, and consolidated with one in Iowa. The big packing houses were closed, victims of decentralization to newly designed plants in smaller, lower-cost labor markets nearer the sources of livestock. Large, long-established refrigeration equipment plants had been sold, and the operations either moved or were about to be moved to the South or to smaller cities in the Upper Midwest. The millwork and apparel industries had declined, consolidated, and decentralized. Breweries had declined and consolidated. Most of those events reflected pervasive national trends. Another set of industries had undergone a metamorphosis, with significant net growth. Jobs, products, and even companies had disappeared; while others had formed and grown. The vastly expanded business services sector now provided a market for innovative manufacturing in such fields as advertising novelties, displays, printing and publishing, plastics, packaging and packaging machinery, and building maintenance equipment. The burgeoning health care industry opened up support opportunities for manufacturing of specialized office and hospital supplies. Even the ubiquitous food industries were transformed, as health foods and exotic foods burst on the marketplace, and carbonated beverages replaced water as the common national drink. Other lines of consumer goods, such as toys, drugs, and cosmetics, followed suit.
(p. 186)
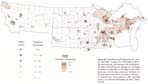
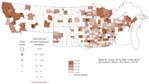
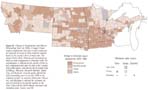
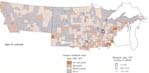
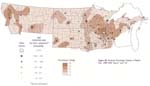
Figure 60. Manufacturing Employment, by county, 1929-1980. (2 pages) The 1929 pattern reflects the overwhelming concentration that developed at the Twin Cities during the railroad era, the legacy of lumber-era industries in the Upper Great Lakes forest area, and the legacy of pioneer enterprises in the older farm trade centers of southern Minnesota. Dispersal was much greater in 1980, especially in the Com Belt and Minnesota core area. Source: note 84. (p. 187)
Figure 60, continued.
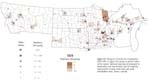
(p. 188)
Figure 61. Change in Manufacturing Employment, by county, 1929-1980. The pattern reflects the importance of urban markets, innovation, and branch plant expansion around major urban centers. Source: note 84.
(p. 189)
Twin Cities entrepreneurs were quick to respond to each new opening. Many were able to build a solid foundation in the local and regional market, then push their patented or specialized or high-quality products into national or even international channels. Twin Cities companies emerged as national market forces in items ranging from children's games and toys to home and commercial cleaning preparations to water bagels, packaged nuts, and soft drinks; from check printing to medical periodicals and in-flight airline magazines. Meanwhile, the historic manufacturing of large machinery and metal goods also adapted and specialized in a wide range of new markets. Local companies had become leaders in the national and world markets for a long, fascinating list of products. A few examples suggest the diversity: truck refrigeration, microwave ovens, industrial floor-cleaners, lawn and golf course maintenance equipment, earth-moving and paving machines, portable electric generators, giant turbines, wind tunnels, and automotive lubricating equipment.86 An important characteristic of many of the mechanical products was their large size in combination with custom crafting —each machine designed and engineered to specifications for a particular task at a particular site. Many products involved neither routine assembly lines nor standardized engineering and sales programs. These were large-scale craft industries. That half-century may well have seen the full flowering of the mix of industrial talents brought to the place in the nineteenth-century by skilled northwest Europeans and Yankee entrepreneurs, carried on by many of their more educated and affluent children, and reinforced by the skills and attitudes of immigrants overflowing from the region's maturing rural areas. Of course, the most dramatic gains were in the fields of electronic computing, communication, control, and measurement. In the Twin Cities, these industries were the largest and fastest growing, and they exported worldwide. Long-established companies; most notably Honeywell, expanded in those fields. Most were newer, mainly post-World War II-from giant Control Data and Sperry to diverse medium-size companies that produced supercomputers, word processors, cardiac pacemakers, hearing aids, and a wide range of equipment for computer applications. Meanwhile, the company that had become largest of all was the virtually unclassifiable, decentralized 3M. From mainly an innovative producer of sandpaper in the 1920s, its remarkable marketing, research, and development enterprise had spawned a constantly changing family of several dozen worldwide divisions. While 3M's theme seemed to center on tapes and adhesives, with a growing electronic component, it made a wide range of consumer, business, and industrial products. Nonproduction jobs accounted for more than 70 percent of Twin Cities manufacturing employment gain from the 1950s to 1980. Those jobs reflected the elaboration of headquarters, administrative and professional work, and the growth of research and development. The Twin Cities were the only urban area in the Upper Midwest where non-production industrial job growth was above the national rate. Nearly three-fourths of the growth occurred on the Minneapolis side of the metropolitan area. The metropolis also had the highest production wage rates in the region (Figure 62). As a result, in the trucking era, and especially from the 1950s onward, there had been a steady retreat of manufacturing plants from the central area first to the outer suburbs, satellite rings, and rural areas, then to the South, and eventually to the Mexican border cities and East Asia. Up to the early 1980s, at least, the shift had been mainly in consumer products, metalworking, and mechanical industries. In those industries, compared with electronics, there was less interdependence among production, research, development, and day-to-day entrepreneurial activities. While the Twin Cities central and suburban counties registered the greatest absolute growth, the surrounding agricultural trade centers had the greatest relative increase. To be sure, manufacturing employment in the Twin Cities metropolitan area in 1980 was more than double the 1929 level. But in the Twin Cities Satellite Ring, together with the urban clusters of Southern Minnesota, the Minnesota Lakes, LaCrosse-Chippewa Valley, and Upper Wisconsin Valley, the increase was more than threefold. Growth was also more than triple in the remainder of the Corn Belt and west to the valley of the James. Thus industry both grew and spread where the density of farms and county-seat trade centers was highest. Those were the areas nearest the Twin Cities and Chicago with the most accessible resource of underemployed rural labor. In southern Minnesota and north-central Wisconsin- already moderately industrialized in 1929 -125,000 manufacturing jobs were added in half a century. From those areas westward to the James, the additional increment was 55,000.
(p. 190)
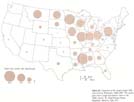
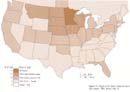
Figure 62. Average Hourly Wages of Manufacturing Production Workers, 1977. Source: note 84.
(p. 191) Again, the net increases concealed considerable decline and transformation. There was substantial consolidation and closing of plants in flour milling, brewing, brick and tile, pottery, and textiles and apparel. In the vegetable-canning and dairy industries, there was consolidation into fewer, far larger, more modern plants. Canning expanded into freezing and continued to concentrate in its naturally favored area in south-central Minnesota. Hundreds of rural and small-town creameries closed and were replaced by larger, more mechanized plants, diversifying their traditional butter output to include cheese, ice cream, and dehydrated products. The heart of the beet sugar industry shifted from western irrigated oases to lower-cost locations on the northwestern margins of the Middle West. Western sugar mills closed; while others were enlarged, modernized, and multiplied in an arc from the Red River Valley to Mason City, Iowa. Meat packing decentralized to smaller, more automated plants throughout the Corn Belt, although large plants continued to operate at Austin and Albert Lea, in the southern Minnesota urban cluster. Most growth and development came in the variety of industries less directly related to agriculture and the processing of local raw materials. Many plants were indeed making farm equipment and accessories, food packaging, and fertilizers; one was building extra-large, luxury tractors that were sold worldwide. Major snowmobile and hockey stick producers at the towns near the Minnesota-Canada border and boats from other Minnesota locations helped exploit two of the region's most abundant natural resources: frozen winters and water. But a great variety of products were much more unlikely according to the usual measures of local natural resoures and access to national markets: truck and auto accessories, sophisticated electrical switching equipment, machine tools, heating and air-conditioning equipment, mobile homes and motor homes, industrial loaders, portable metal and plastic storage mega-structures, optical lenses, computers and other electronic gear, robots, high-altitude research balloons, precision instruments, long-distance motor buses. Nameplates on dozens of products carried to remote corners of the world the names Wausau, LaCrosse, Rochester, Owatonna, Mankato, St. Cloud, Sioux Falls, Fargo, Red Wing, as well as Forest City, Iowa, and tiny Gwinner andPembina, North Dakota. A manufacturer of micrometers, advertising its product in the Wall Street Journal in the 1970s, always proudly listed in boldface type the main office address in St. James, Minnesota, within finer print—"branch offices at New York, Chicago, and Los Angeles." Indeed, at least half of the new manufacturing jobs in these smaller towns and cities were created by local innovators and entrepreneurs. The others were branch plants, mainly out of homegrown firms in the Twin Cities and, to a much lesser extent, Chicago. An exception in every way, of course, was the 6,500-employee IBM (International Business Machines) plant at Rochester, Minnesota. Manufacturing employment at the agricultural trade centers was mainly in production jobs, especially in South Dakota. That reflected the importance of branch plants in the growth picture. Those firms with branch plants tended to keep headquarters, research, and development in the Twin Cities or other major centers. Locations of both branch and homegrown plants were influenced by availability of lower-priced, skilled, dependable labor as well as lower local taxes and other overhead savings in the smaller places. Although average labor costs of production were not appreciably different across state lines, there were significant differences in state taxes and mandated employee fringe costs. In the Upper Midwest, Minnesota had the highest costs, South Dakota the lowest. As a result, some companies moved their manufacturing operations from farm trade centers in Minnesota to counterpart cities in South Dakota. Several Twin Cities firms joined in shifting or expanding substantial production to eastern South Dakota, along with moves to the southern states. There were also shifts from the Twin Cities area to western Wisconsin, but those were much more a part of the general spread in all directions from the central cities to the satellite ring of counties. In the Twin Cities area, continued growth in electronics and business service products far more than compensated for losses to South Dakota. But little of that compensating growth spread beyond the suburbs, at least into the early 1980s. Outside the metropolitan rings only the tax-related losses to South Dakota were readily apparent. The tendency for those shifts became noticeable in the 1970s and increased sharply in the early 1980s. Disturbing signs of weakness appeared after a quarter-century to a half-century of solid industrial growth. The resulting alarm added to the rising pressure for tax review, reduction, and reform in Minnesota.87
(p. 192) In the Great Plains and Black Hills, auto-era industrial development remained as it had been in the rail era —small and almost entirely restricted to the main urban centers. Only 5,000 net manufacturing jobs were added in half a century at Grand Forks, Minot, Bismark-Mandan, Rapid City, and Billings combined, fewer than 2,000 in all other towns and cities of the semiarid country. Most of the additions were in the ubiquitous local food industries or in the local business service industries such as printing and publishing, metal-working, plastics, or packaging. In the Montana mountain valleys, growth in those industries was augmented by increases in lumber and paper milling and by a few small, footloose computer-related and craft industries, especially in the two principal university towns of Missoula and Bozeman. Meanwhile, the gains were offset by serious declines in copper smelting and refining. In the northern forest areas, 4,000 manufacturing jobs were lost in the half-century in industries related to mining and lumber milling, but more than 6,000 were added-partly as a result of the transformation from sawmill-ing to pulp and paper, and partly through the growth of local industries for consumer and business service markets in the main urban centers. In the only metropolitan area — Duluth-Superior and the Mesabi Range-locally oriented industries and a few of the wood-product and machinery makers held their ground. The homegrown division of a national educational publisher expanded, even made headlines by transferring a number of headquarters jobs from Cleveland, Ohio, to Duluth.88 While the steelworks shut down, medium-size export industries seemed to keep forming, moving in, dissolving, or moving out —oriental food, frozen pizza, telephone equipment, men's apparel. Hundreds of jobs formed and dissolved in the same cyclical pattern. Some of those firms were homegrown, others were branch expansions and contractions of national corporations. The performance perplexed both local leaders and entrepreneurs, who continued to seek stable export industries appropriate to the location and the labor force.
CONSTRUCTION AND COMMUNITY
The construction industry is a special kind of manufacturing. It assembles its finished products at the point of sale and sells them at the point of consumption. Furthermore, the products are rooted in the ground, and their use is almost totally limited to the point of sale. Thus, unlike other products, buildings express more than an effort to produce and consume. They are a commitment to the place where they are built by the people who pay for building them. As more people build and make commitments to the same place, a geographical community is created or reinforced.
Construction also provides a way to transfer wealth from one region to another. A geographical shift of wealth takes place when people and a business firm move, then build at their new location. There is a similar shift when capital accumulated at one place is invested in building up a different place, and people follow.
In the United States, capital transfers through construction have amounted to hundreds of billions of dollars in the auto era. The underlying population shifts are well known. The Northeastern and North Central states' share of the nation's population has declined, and most of the Southern and Western states have gained. Strong shifts in capital outlays for construction have accompanied the population shifts. In the east North-Central and Northeast states —Wisconsin and Illinois to the Atlantic Seaboard —the share of the nation's new construction declined even more than the share of population. Elsewhere, construction gains exceeded population gains.
(p. 193)
The region's industries have in fact been a dynamic succession of start-ups, expansions, mergers, sell-outs, acquisitions, conversions, adaptations. A varied flow of products, skills, and ideas has poured from a wellspring of individuals and organizations. Concentration on a few famous products has continued (Figure 64). But the other hallmark of the region's industry has been growth and innovation. Above-average innovation has been necessary to sustain growth, in the face of competition from areas with longer histories, better market accessibility, or lower wages. The vast majority of the industries have been homegrown. To be sure, the people who created them were not necessarily homegrown. Perhaps half were. The others were immigrants from other parts of the United States or abroad. Nor has industry managed to keep all of the local talent it would need. Skilled people left when growth was slow, returned when it picked up. In 1960 the personnel director of a major Twin Cities electronic firm told me, "When we are expanding, we find that the best place to recruit is in southern California. That's where we find the largest number of people from this region. And they don't have to be sold. They known the place." A quarter-century later, the president of a Twin Cities research and development firm told a newspaper reporter that one recruiting strategy would be "locating Midwesterners working in California's Silicon Valley." Both could have added that they would gladly have taken anyone else who qualified and wanted to become familiar with this mysterious part of America. In an era of high mobility and intensely interactive society, the whole country has become a temporary reservoir for the export surplus of skilled people from any region at any given time. But the Upper Midwest has long been a leading producer and exporter, and the rest of the country has long been storing a part of the region's reserve labor supply. Thus the Upper Midwest became a fertile seedbed of entrepreneurship; home base of a somewhat dispersed skilled labor force; adopted home to self-selected migratory entrepreneurs, professionals, and technicians; focus of a commitment to build, maintain, improve, and rebuild. It appears that an industrial community emerged on the circulation network that ties together the region's farms, towns, cities, lakes, forests, plains, and mountains. Industry provided a current of continuity in the turbulent demographic stream. Wholesale and Retail Merchants As the rail era drew to a close in the 1920s, 290,000 people worked in wholesale and retail trade in the Upper Midwest. About one-fifth of those jobs were in wholesaling, the others in retailing. By 1980 the total number had grown to more than 750,000, with little change in the proportions of wholesale and retail jobs. Perhaps one-fifth of the 50-year employment increase was the result of population growth. The other four-fifths reflected the vast growth of purchasing power and available goods. The basic task of the merchants remained the same: to link producers with consumers, to organize and smooth the flow of goods through a very complex system.90
THE LEGACY OF RAIL-ERA PATTERNS
One large, distinctive group of wholesale merchants in the 1920s included the assemblers and forwarders of farm products. They were mainly in the grain and livestock business, and they were located all along the rail lines in places of every size from sidetrack hamlets to the Twin Cities. Grain flowed by the wagon- or truckload from farms to country elevators with typical capacities of 25,000 to 50,000 bushels. From there it moved by rail carload to much larger terminal elevators at major junctions in the region's cropland corridor. Or it went to Duluth-Superior or the Twin Cities where elevator capacity was 50 to 100 million bushels. Grain not milled in the region was likely to move by the trainload from the Twin Cities to distant milling centers in the Midwest and East, or by the shipload from Duluth-Superior to Buffalo. Livestock were assembled at pens and ramps at hundreds of towns along the rail lines, herded into cattle cars, and shipped to central yards. Most of the shipments moved east, through markets at Fargo, Sioux Falls, and South St. Paul, or on to Sioux City, Omaha, or Chicago. From those places the animals were sold to Corn Belt farmers to be fattened or to the packing houses to be slaughtered. Twenty thousand to 30,000 cattle, hogs, and sheep moved through the region's major markets on any trading day. Meanwhile, more than nine out of 10 retail and wholesale employees were distributing, not assembling, and they were handling food and manufactured goods, not farm commodities. The wholesalers distributed goods from large, primary industries to smaller fabricators, and from industries to retail stores. Wholesale warehouses and retail stores alike were clustered at the region's transportation nodes, from the primary railroad center at the Twin Cities to the smallest crossroads hamlet. They were all central places in the circulation network. They formed a system of trade centers. Rank in the system depended for the most part on accessibility. In wholesale distribution, virtually all the warehouses and jobs were located at the major railroad centers, thus also at the largest cities. Key retail locations were at central places in consumer travel patterns. The bigger the market was, the busier the central place, the more numerous and bigger the stores, and the more diverse the goods offered. The greater the diversity of goods was, the larger the number of specialties, and the wider the drawing area.
(p. 194)
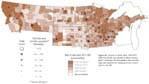
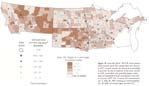
Figure 63. Change in Construction Employment 1929-1980. (2 pages) The change in pattern reflected the region's relatively high rate of investment in maintenance and improvement and the relatively rapid growth of many small cities and small metropolitan areas. Source: note 84.
(p. 195)
Figure 63, continued.
(p. 196)
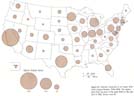
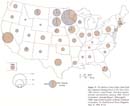
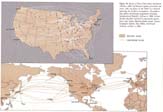
Figure 64. Worldwide Locations of Major Upper Midwest Manufacturers, 1984. Corporations included 3M, Honeywell, General Mills, and Pills-bury. Source: Moody's Industrial Manual (New Yorlc: Moody's Investment Services, 1984).
(p. 197)
Geographical expression of the system was a hierarchy of trade centers. Te Twin Cities were at the top. A half-dozen primary wholesale-retail centers were next, followed by eight secondary wholesale-retail centers, more than 100 large, medium-sized, and small shopping centers, more than 500 convenience centers, and about 2,000 hamlets, all arrayed in descending order.91
The hamlets typically had no more than a dozen businesses —most commonly one or two grain elevators, a creamery, a general store, and a cafe. Today's ubiquitous business establishments —the bar and the gas station— were not so common in the 1920s. Storefront gas pumps and filling stations had just begun to proliferate. And bars were temporarily out of sight because of the national prohibition law that bore the name of congressman Volstead from Minnesota. The typical hamlet trade area encompassed little or no more than the surrounding township. In contrast, the convenience centers provided grocery, drugstores, hardware and variety stores, a few specialty shops, and banks, as well as eating places and farm services. Each convenience center served the combined trade areas of three or four neighboring hamlets. Shopping centers were larger urban places —average populations of 5,000 to 10,000. To the array of convenience stores they added department stores and a much wider range of specialty shops, as well as a full range of basic professional services to augment the offerings of the merchants. Thus each shopping center served not only its own convenience trade area but also the convenience trade areas of half a dozen or more neighboring small centers. The shopping centers' trade areas usually spread over parts of two or three counties. Their solid Main Street business facades ran three or four blocks or more. Their high-school sports teams had to travel 30 to 60 miles to find competition from another community as large or larger. Only 15 urban centers added a substantial layer of wholesale employment on top of the retail base. These centers included the Twin Cities, primary wholesale-retail centers, and secondary wholesale-retail centers. The main wholesale gateway to and from the nation was the Twin Cities. There stood the largest warehouses-massive architectural monuments to proud Yankee family names such as Farwell, Ozmun, Kirk, Janney, Semple, and Hill, or to Chicago's Butler brothers. Miles of smaller warehouses lined the rail corridor through the cities. Their trade territory covered today's primary region of the Upper Midwest and filtered into the Canadian Prairies and the Pacific Northwest. The retail base included several of the Midwest's great downtown department stores. Hundreds of specialty shops did business in the downtowns and in neighborhood shopping districts at major crossings in the streetcar network, and thousands of corner convenience stores opened along the car lines.
Duluth-Superior was the largest of the half-dozen primary wholesale-retail centers. The great Marshall-Wells and Kelly-Howe-Thomson warehouses pressed against the harbor's edge on Minnesota Point, and merchant wholesalers crowded blocks of multistory buildings between downtown Duluth and the waterfront. Their sales territories dominated the western Lake Superior district and reached selectively all across the Upper Midwest and into the Canadian Prairies. The other primary wholesale-retail centers were Fargo-Moorhead, Sioux Falls, and Great Falls in the west, LaCrosse and Eau Claire-Chippewa Falls on the east. The two eastern cities had developed as mercantile centers on the northwest frontier in the nineteenth century. The western centers had developed their own territories across the Dakotas and Montana, especially for high-volume, low-margin goods such as groceries and some lines of hardware, drugs, and sundries. Many of their warehouses were branches or partnerships of Twin Cities and Duluth wholesalers. Secondary wholesale-retail centers distributed more limited lines and carved out smaller, more specialized territories. Wausau merchants filled that niche in the Upper Wisconsin Valley; Mason City, in north-central Iowa. Grand Forks and Minot played the same role at important junctions along the Great Northern High Line through North Dakota; Aberdeen, at a major junction on the Milwaukee Road's transcontinental line across northern South Dakota; Rapid City, for the Black Hills; and Billings, Butte, and Missoula, for southern and western Montana. Beneath the wholesaling superstructure at each primary and secondary center, the retail base included multiple downtown department stores, scores of specialty shops, and hundreds of outlets for convenience goods such as food, hardware, and household supplies.
An umbrella of catalog mail-order retailing spread over the whole region. Minnesotan Richard Sears had started his mail-order watch trade in 1886, when he was a railway station agent near Redwood Falls, in the Minnesota prairies. He had run his fulltime business from Minneapolis through most of the next decade before moving permanently to Chicago to join A. C. Roebuck in their ultimate venture. By the 1920s, the major Minneapolis department stores and the multistory, block-square landmarks of Sears Roebuck and Montgomery Ward carried on the Upper Midwest mail-order tradition from the Twin Cities.
(p. 198)
Table 5. Wholesale, Retail, and Service Employment in Trade Centers by Size Classes, 1980
Beneath the mail-order umbrella, most retail stores and many of the warehouses were locally owned. Merchants were positioned at every center throughout the system. Thousands of families eked modest incomes from long hours of work in drugstores, grocery and hardware stores, or crossroads general stores. In the multi-county shopping centers, 100 or so families earned comfortable livelihoods from their local department stores and occupied solid Victorian homes nearby on the elm-shaded sections of the main streets. Merchant families and companies rose to dominant positions in the major cities. Meanwhile, mainly out of Scandinavian traditions, an exceptionally large number of locally controlled marketing and consumer cooperatives arose out of the rural areas to challenge and limit the dominance of the corporate traders. As the region developed, the merchants had met the challenge to create an orderly, far-reaching trading system. But the system depended on railroad trains. And in the 1920s, it was showing signs of disintegration under the fast-growing influence of auto-era changes. The existing system had to be modified to handle the vastly increased quantity and diversity of goods. And it had to be adjusted to highways, trucks, and telecommunications. THE CHANGES OF THE AUTO ERA The hierarchy of trade centers inherited from the railroad era was still evident in 1980 (Table 5). The bigger cities commanded the market. The wholesale-retail centers and the shopping centers had large shares of the region's trade employment compared with their shares of population, while the smaller population centers had even smaller shares of the wholesale and retail payrolls. At the same time, Upper Midwest merchants made major adjustments to the new pattern of accessibility. The local share of the region's trade employment grew faster than the local share of population in some classes of trade centers, slower in others (Table 6). In the wholesale assembly and forwarding of farm commodities, the smaller trade centers clung to their role. But there were dramatic changes. Many of the old, smaller grain elevators became auxiliary buying and storage stations for newer and fewer steel and concrete compounds with capacities of 300,000 to a half-million bushels. Trucks handled most of the shipments both in and out of the smaller elevators. Long strings of covered hopper cars with capacities of 100 tons replaced the stubby 20- to 40-ton boxcars of an earlier era. The new hoppers served the big elevators. Many were made up into unit trains that moved directly not only to the Twin Cities and Twin Ports but also to major overseas terminals at New Orleans, Houston, Portland, orthePuget Sound. Trucks replaced railway cattle cars almost entirely in the movement of livestock to wholesale markets. As a result, decentralized auction yards-joined by telephone or teletype networks for price and marketing information—operated on the outskirts of scores of county-seat trade centers. Truckers brought the livestock from area farms and ranches and hauled the animals away to feeders and new, decentralized packing plants.
(p. 199)
Table 6. Change in Percentage of Upper Midwest Wholesale, Retail, and Service Employment and Population In Trade Centers by Size Classes, 1940-1980
The efficiency and range of trucking transportation had
further concentrated wholesale distribution of food and factory products at the
larger centers (Figure 65). By 1980 more than two-thirds of all wholesaling
employment and three-fourths of sales were located in the Twin Cities and in the
primary and secondary wholesale-retail centers. But the auto era brought some
changes within that family of top-level trade centers (See Table 6).
There was limited decentralization from Twin Cities locations to smaller places.
While Twin Cities
wholesale employment grew dramatically their
share of the region's total wholesale jobs grew
somewhat slower than their share of population.
In Duluth-Superior, the number of wholesale
jobs was stable, but the share of regional total fell catastrophically. Economically troubled Butte dropped out of the wholesale-retail class. Chief
beneficiaries of those shifts were
the other wholesale-retail centers. Fargo-Moorhead had passed Duluth-Superior in
sales and jobs. Billings had surged into the primary ranks and passed Great Falls. Bis-marck-Mandan, St. Cloud, Mankato, and Rochester had joined the secondary
ranks. Additional beneficiaries were
a few smaller places in the Twin
Cities Satellite Ring, the neighboring
Southern Minnesota urban cluster,
and eastern South Dakota. They accounted
for most of the surge of wholesale employment in the medium-size
shopping centers shown in table 6. Their new
warehouses were served partly by rail,
mainly by truck. Their trade territories continued to center on the Minnesota
metropolitan core while extending not
only across the Upper Midwest but also into
much of Iowa, Wisconsin, Nebraska, and Wyoming.92
Auto-era growth of retail employment concentrated at the Twin Cities, at the seventeen primary and secondary wholesale-retail centers, and at fewer than 50 large and medium-sized shopping centers (Figure 66). Cities in those size classes generally increased their shares of retail sales and employment, but the shares at smaller places declined (See Table 6). People could travel farther to shop, and they went to the larger, more widely spaced centers. Increased trade at those places meant more and bigger stores. They attracted the major chains and, eventually, the developers of enclosed malls. The Twin Cities market by 1980 was organized around eight major malls, built near the belt freeways, with average floor space about one million square feet. Meanwhile, enclosed skyway networks had transformed the rebuilt downtowns into sprawling super-malls. Emerging once more as a unique rendezvous for the region was the linked array of department stores, myriad specialty shops, and classy boutiques in a setting of office skyscrapers and hospitality and entertainment places. There were also enclosed shopping malls at every primary and secondary wholesale-retail center, and the average size of each mall was nearly half a million square feet. The malls brought the shopping amenities of the smaller metropolitan areas practically on a par with all but the most affluent of the Twin Cities suburbs. By 1980 enclosed malls had also been developed at about half of the large and medium-sized shopping centers. Those averaged about 200,000 square feet, with a minimum trade area population of about 50,000. Changes in business organization of trade accompanied the geographic shifts. To be sure, thousands of individual stores and hundreds of small wholesale firms remained in family hands. But in many cases, a family now owned and operated two, three, or more stores in the same city or in neighboring rural convenience centers. Good roads, phone links, on-line electronic bookkeeping, ample rural bank credit, and cooperative purchasing had enlarged the family store as auto-era innovations had enlarged the family farm. National chains invaded the domain of the family-owned local department stores in the multicounty shopping centers and the metropolitan areas. But they were countered by regional and local organizations. For example, regional chains were developed by entrepreneurs based in Wausau, St. Cloud, Jamestown, North Dakota, Great Falls, and the small Dutch and East Friesian settlement at Clara City, on the western Minnesota prairie. The leading downtown Minneapolis department store built the nation's first enclosed suburban mall, branched to several of the new, smaller metropolitan areas in the Upper Midwest, then expanded to become one of the nation's half-dozen largest retail corporations (Figure 67). Twin Cities firms emerged among the nation's major grocery and hardware wholesalers (Figure 68). Twin Cities entrepreneurs developed national and international franchising operations in food and general merchandise, as well as leading organizations in direct-mail and catalog retailing and merchandise premiums. Three of the farm cooperatives became retail giants, with outlets across most of the Midwest and Great Plains. One of the grain-trading firms became the world's largest merchant of agricultural commodities. Headquarters of those firms accounted for thousands of retail and wholesale jobs. Meanwhile, general merchandise wholesalers to the old country stores either specialized or drifted into oblivion. Ownership of major store buildings passed from individual merchants on Main Street to local syndicates or regional and national shopping-center developers.93
(p. 200)
Figure 65. Changes in Employment and Sales in Wholesaling Since the 1930s. (2 pages) Export surplus employment and sales in each county are the amounts in excess of what would be expected based on the county's share of retail sales. Size classes (Twin Cities, Primary and Secondary) are based on total employment in wholesale trade. Decentralization is reflected by the growth of both export employment and sales in most of the counties with urban places, and also by the increased ranks of Billings, Missoula, Bismarck-Mandan, Rapid City, and Rochester. Growth partly reflected the high commodity prices in the late 1970s in the cropland corridor. In southern Minnesota, Wisconsin, and Michigan it reflected the increased volume of trucking to the growth markets in the Twin Cities and the North Woods retirement and recreation areas. Source: note 90.
(p. 201)
Figure 65, continued.
(p. 202)
Figure 66. Growth in Retail Sales, 1929-1977. Auto-era growth concentrated at about seventy places, including the metropolitan areas and the large and medium-size shopping-service centers. Source: note 90.
(p. 203)
The region's merchants had shifted from rail-era organization to auto-era reorganization and adaptation. Wholesaling patterns had changed to accommodate unit trains, trucks, and mass merchandising. Retailing changes had resulted in cost reductions with increased selection and amenities for enlarged shopping trade areas. At the major shopping centers, the concentrations of stores and customers meant that a greater value and diversity of goods were handled per employee, with lower prices and more outlay per square foot for displays and furnishings. Yet there was also sustained convenience and availability of goods in rural areas despite greatly reduced farm population density. The smaller towns moved a lower volume of goods per retail employee. For most lines of merchandise, their stores were smaller, purchases were smaller, or there were fewer sales. They tended to provide convenience at somewhat higher prices or lower returns for a more dispersed, but more affluent, rural population. Thus many new arrangements emerged; but consistent themes were growth, innovation, efficiency, and practicality. Service Employment Nearly one million service jobs were created in the Upper Midwest between 1929 and 1980 - double the number of farm jobs that disappeared during the same period. Explosive growth of leisure, and of the production system that made it possible, was accompanied by explosive growth of service employment. When Upper Midwest native Thorstein Veb-len published his famous Theory of the Leisure Class, leisure time was still a scarce, precious commodity for the great preponderance of Americans. That was in the middle of the steel rail era, just before 1900. The national circulation system was still being completed. Still under construction was the basic framework for the productive system that would pour out far more goods with far less labor and that would multiply the capacity for exchange and interaction. But in 1980, the system had been built for more than half a century and already had been completely transformed once. By the standards of the 1890s nearly everyone in the country was now a member of some kind of leisure class. In both the Upper Midwest and the country as a whole, nearly half of the employed population worked to serve the needs of that ubiquitous class of Americans.94 By the 1980s, everyone encountered service employees at every turn in life. That broad job classification included the nurses in the maternity ward at birth; the teachers from kindergarten through high school, technical institute, and college; the camp directors, bus drivers, and custodians. Then service workers appeared as employment agents, counselors, librarians, bartenders, TV artists, and disc jockeys. Service employees ran skating rinks, bowling alleys, ballrooms, and provided the music to dance and romance. For those who were forming families and entering the housing market, they included ministers, real estate brokers, architects, bankers, lawyers, garbage collectors, and plumbers. On business and pleasure trips they appeared as convention managers, hotel staff, ski instructors, horse trainers, sauna employees, and game wardens. In times of misfortune, service employees included the police officer, judge, insurance adjuster, ambulance driver, and social worker. They made the travel arrangements for a return to family roots in Smaaland, Schwabia, or the Hardanger Fjord, or a pil-grimmage to Nashville, Las Vegas, orWaikiki. They included the computer programmer for Medicare, the cemetery lot salesperson, the nursing home attendants, and the mortician. Some services belong more distinctly to the Upper Midwest. For example, many service employees were paid staff for voluntary organizations. Organized volunteers stretched services still wider and pushed them deeper into the community. Just as the region has been a secure center for organized religions and politics, so it has been an exceptional stronghold of voluntary organizations — cooperatives, neighborhood associations, lodges, health care groups, charities, international exchanges. When a central Minnesota parish priest blessed the snowmobiles before a weekend dash across winter drifts to quaint taverns, that was another example of Upper Midwest service employment. crew came in predawn darkness on Christmas morning and worked in -70° windchill to repair a snapped electrical wire that was flashing eerily where its hot tip writhed in two feet of wildly blowing snow, that was also service — perhaps the most Upper Midwestern of all.
(p. 204)
Figure 67. National Expansion of the Upper Midwest's Largest Retailer, 1950s-1984. The system grew from one store in the early 1950s to this pattern in 1984. Source: note 93.
(p. 205)
Figure 68. Expansion of the Largest Upper Midwest Grocery Wholesaler, 1940s-1982. The system grew from a single distribution center in the 1940s. Source: St. Paul Pioneer Press-Dispatch, March 8, 1982, B-9.
(p. 206)
In fact, the service jobs are different from other jobs. Others produce goods and commodities and move them through the productive system. But service jobs are connected with maintenance and with leisure. They are concerned with maintaining knowledge, personal relations, personal health, buildings, equipment, natural resources. They are also concerned with the conservation and use of leisure time. For example, they furnish credit accounts, loans, banking, insurance, or brokerage to conserve time in the management of most people's complex personal business. They furnish reading, study, parks, arts, casinos, and hospitality for the use of leisure. In both positive and perverse ways, service jobs are essential to community organization and continuity. Service employment in the 1980s was strongly concentrated at the Twin Cities and at the primary and secondary wholesale-retail centers, and the concentration at those places had increased since World War II (Figure 69). Growth was especially strong at the Twin Cities. Service employment there had outpaced retailing and wholesaling as a symbol of regional centrality. A large part of the growth came from innovation, stimulated by the chances for interaction among many minds in a great variety of settings. National and international contacts provided additional stimulus and opportunity. The result was exceptional development in such service fields as health, advertising, marketing, and management. Colleges and universities accounted for substantial additions to service employment at eighteen of the twenty primary and secondary wholesale-retail centers. A nineteenth—Rochester, Minnesota-was the home of the Mayo Clinic. Only Great Falls lacked one of those major service employers. Other relatively large concentrations of service employment were in smaller, more specialized university towns such as Vermillion, South Dakota; in the major lake resort areas; and on the Indian reservations, where government administration and teaching provided much of the paid employment.
Upper Midwest people in 1980 spent a share of their income on services roughly equal to the national average. But they spent an estimated 5 percent to 10 percent of the total outside the region—mainly in Florida, California, Nevada, and Hawaii. However, they exported services to other parts of the country and the world to pay for their excursions to the Sun Belt, and many other expenditures. Some of the nation's largest bank credit-card operations were operated from Sioux Falls; motel chains from Aberdeen and St. Cloud; franchise campgrounds from Billings; insurance from Wausau, Owatonna, Sioux Falls, Bismarck, and the Twin Cities. Twin Cities offices administered nationwide financial services, international car rental and container-leasing services, advertising accounts, more than a billion dollars a year in national sales of business travel incentive arrangements and hair-styling shops, and hundreds of millions of dollars in convention and resort trade (Figures 70-71). Services were also exported in the arts. There were national broadcasts, tours, and recordings of stage and musical groups. Several thousand people in Minneapolis produced an important share of the country's television commericals. University-based research earned more than $100 million in national support.95 Business headquarters play an especially important role in the export of services through the management of national and international enterprises. In the early 1980s the 200 largest Upper Midwest corporations had created $50 billion in assets and nearly one million jobs worldwide. Well over 90 percent of the region's large and medium-size employers and virtually all the corporations headquartered in the region were homegrown. Recall that the story of manufacturing, trade, and services expansion in the automobile era was replete with cases of local innovation and creative development. The unusual concentration of entrepreneurship was evident in the 1970s. The Upper Midwest was one of three high spots on the national map of number of Dun and Bradstreet listed firms per 10,000 population (Figure 72). It also had a high concentration of headquarters of the top 1000, or high-order American business firms (Figure 73). Thus there appeared to be both a large seedbed and a high rate of success.96 Regional business entrepreneurship has a long history. The Twin Cities has been a major center of railroad headquarters in the railroad era, a major center of airline headquarters in the air age, a major center of computer industry headquarters in the computer age (Figure 74). A 1974 study showed that for a century— except for wartimes-there was a fairly steady emergence of companies destined to become major forces in the economy.97
In the early 1980s the same tendency was still in evidence. A major business magazine made its annual national survey of most promising medium-size corporations, and the Upper Midwest was consistently, strongly over-represented, for its population (Figure 75). In fact, the Twin Cities had by far the highest concentration of those companies among the nation's metropolitan areas of one million or more. The dozen firms listed in the 1980 survey had created more than 12,000 jobs in less than a decade of existence. The region's traditional diversity was evident as well. Although electronics firms made up the largest group, they were less dominant than their counterparts in other growth locations-notably Boston and San Francisco.98
(p. 207)
Figure 69. Growth in Service Employment, 1929-1980. On the map emerges the location pattern of nearly one million service jobs created between 1929 and 1980. Source: notes 78, 90.
(p. 208)
Figure 70. The Upper Midwest's Leading Car Rental Organization, 1983. The pattern represents expansion from one agency in Minneapolis in the 1950s. Source: World-Wide Directory, National Car Rental, Sept.-Oct. 1983.
(p. 209)
Figure 71. The Realm of Three Major Bank Holding Companies Headquartered in the Twin Cities, 1984. Sources: Lloyd Brandt, First Bank System, personal communication, January, 1985; Norwest Corporation, Annual Report, (Minneapolis, 1984); map of bank locations of Bremer Financial Corporation, St. Paul Pioneer Press-Dispatch, May 14, 1984, B-l ff.
(p. 210)
Figure 72. Relative intensity of the "entrepreneurial seedbed": ratio of Dun and Bradstreet Listed Firms to total population, 1978. Sources: Dun and Bradstreet Directory, 1978; U.S. Bureau of Census, Statistical Abstract of the United States 1978.
(p. 211)
Figure 73. Homes of the Nation's Largest Business Corporations in the Mid-1970s. From the local seedbed of small and medium-size businesses, in most states at least one company had grown to join the ranks of the nation's top 1,000. Among the states, Minnesota's business seedbed has had one of the highest ratios of growth of major corporations, reflecting the Twin Cities' role as national and international gateway for the region. Source: note 96.
(p. 212)
Figure 74. Routes of Twin Cities-based Northwest Airlines, 1986. Northwest's system grew from one route, with one plane, in the 1920s to a network spanning the northern hemisphere. The pattern also reflects Northwest's acquisition of locally headquartered Republic Airlines in 1986. In four decades Republic had built a nationwide system from a few Upper Midwest feeder routes. Source: Employees System Time Tables, Northwest Airlines, October 1, 1986.
(p. 213)
Figure 75. Leading Medium-Size Growth Corporations, 1980-1983. The locations of Forbes magazine's "Up-and-Comers"— the annual listing of medium-sized corporations with the greatest chance to attain ranking in the top 1,000 corporations with a decade. Source: note 98.
(p. 214)
In addition, large, established firms were leaders not only in research and development but also in growth and performance. In a 1983 listing of the 50 corporate stocks most heavily held by the nation's major institutional investors, four were Upper Midwest corporations—8 percent of the "Favorite Fifty" based in a region with less than 4 percent of the nation's population and wealth. While corporate creation and growth has been most visible at the regional metropolis, it also has been a feature of many of the smaller centers." Yet, business development and growth has been a chaotic process. Of 275 firms listed in a regional directory in 1968,142 survived to 1975, and only 88 were still operating in 1983. In constant 1983 dollars, 142 survivors had total assets of $55 billion in 1975, and the 88 still in business in 1983 had assets of $75 billion. Thus total assets-and employment-of the initial group grew substantially, although its ranks were thinned by two-thirds. During the same eight-year period more than 100 new companies were added. Assets of all the active companies combined grew at a rate substantially above the national average. In fact, new generation and growth has always had to offset attrition and decline. But turnover has increased in the auto era, with more firms, faster technologic change, and greater intensity and range of movement of information, people, and capital.100 Sales and acquisitions have been the largest component of gain and loss. For example, in 1982-83, about one billion dollars changed hands in the sellout of Minnesota-based companies to firms outside the state, together with outside acquisitions by Minnesota-based companies. The number of firms acquired exceeded the number sold. The exchange was mainly with the American Manufacturing Belt and the West, but some transactions reached into Canada, Mexico, northwestern Europe, Japan, and Singapore — still more evidence of modern national and international linkages (Figure 76). When companies are sold, founders and employees often remain and start new companies. In this way, companies become yet another basic product of the region.10 Attrition has come as a result of outright moves of headquarters. Sometimes production facilities were also shifted or trimmed in size. There are numerous early examples from the textile and apparel industries. One of the nation's largest grain and edible oil processors moved its headquarters from the Twin Cities to a much smaller place in the heart of the Corn Belt in the 1960s. Most recently the giant corporate descendant of James J. Hill's railroad empire —in a move that both reduced executives' state personal income taxes to zero and aimed at reduction of administrative inefficiency-shattered its centralized headquarters in St. Paul.102 Holding company offices moved to Seattle, marketing and railroad head offices to Dallas-Ft. Worth, operations to Kansas City and various divisional centers. Several smaller, privately held companies have also shifted their headquarters. Most of the moves originated in Minnesota and terminated in the Sun Belt. But by far the greatest source of attrition has been those firms that have given up and liquidated —as companies have done everywhere —as a result of fatigue, misfortune, or mismanagement. The long-term, changing regional balance sheet of entrepreneurs, companies, jobs, and assets — even in its broad outlines—remained largely a mystery. Yet, the number of firms and jobs continued to grow. The causes of this remarkable process of business generation are also mysterious and speculative and to some extent perhaps always will be. The process probably has been one part of the larger, distinctive cultural development of the region. Almost certainly the Upper Midwest had a unique social chemistry over a period of two or three generations.103 Seven major elements contributed to development, although it is not possible, or maybe even useful, to list them in order of importance . (1) A large labor force was at hand—first through immigration, then from the region's own overflowing farm areas —with northwest European ethics, rural and small-town work habits, and pioneer American aspirations. (2) The talents of early northwest European — mainly Scandinavian—mechanics were invaluable. (3) Early Eastern entrepreneurs brought Eastern culture and ready access to both Eastern and international capital. (4) A long-term source of basic wealth and income lay in the prairies and Dairy Belt, and an additional one-time infusion of wealth came from exploitation of forests and iron ore. (5) A regional transportation and communication network brought these first four factors together in one relatively large metropolis and there added to them the contributions of immigrants from elsewhere in the United States and the world. (6) A very large land-grant university at the regional metropolis-a situation unique in the country-created a place where faculty and students could not be isolated from the students' families or from the practical chaos and challenge of each day's work, and a place where families and employers could not be isolated from the challenge of new technologies and unorthodox information. (7) A regional transportation and communication network generated constant inter-play-often creative tension—between the metropolis and its countryside.
(p. 215)
Figure 76. Mergers and Acquisitions, 1982-1983. Source: note 101.
(p. 216)
Figure 77. Origins of the Upper Midwest's Business Leaders, 1983. Source: note 72.
(p. 217) Except for the sixth, none of those elements was unique or even unusual. But the combination of them in one region in one time was unique. Of course, just how those elements of the region's chemistry really mingled and interacted, in all of their details, is the subject of countless biographies, local histories, diaries, and memories. The details are not synthesized. The collection of elements and events cannot be reproduced. There can be no recreation of the region as it used to be. Perhaps the elements can be abstracted and institutionalized. That is what some people have suggested, but others have been skeptical. In any case, there is a great legacy on which to build. If the causes of regional entrepreneurship were a mystery, the consequences in the 1980s were clear. A regional service and employment base existed that was highly responsive to shifts of fortune, markets, and technologies worldwide. A cosmopolitan system of linkages joined the world, the metropolis, the small town, and the farm. That system provided avenues of access to the national and international community for local Upper Midwest talent and an avenue into the region for talent from the rest of the world (Figure 77). And a flowing wellspring of investment and philanthropy accompanied a concern about the welfare of people and places in the region. Government as Employer Rapid growth of government employment accompanied the auto-era shift from rail to highway transportation and the explosive growth of services. The public had put itself in the business of building roads and airports. And the public was already well established in service enterprises-notably schools; sewer and water utilities; police and fire protection; hospitals; recreation; pension and insurance programs; and direct provision of money, food, shelter, and clothing to the most needy. Thus, while governments continued to perform their roles in the maintenance of order and justice, around 10 percent of the growth in government employment in the auto era reflected the growth of welfare, and 75 percent to 80 percent reflected the growth of transportation and other services. The questions were what services to socialize and how deeply to be involved. Those turned out to be persistent questions with no persistent answers.104 All the services the public operates through its government agencies arguably could be-and have been—provided privately. There are-or have been-private schools, hospitals, turnpikes, water systems, police and fire protection, insurance, and charities. Public entry into those fields has been an extension of the idea of basic rights and of the quest for individual and collective security. The logic of the right to a decent education or a decent road can be extended to decent water and sewer and even to minimum levels of diet, shelter, and clothing. Like other rights, the guarantee of those services and goods hopefully serves government's basic purpose of justice and order in the long run. With unregulated private supply in many fields, not everyone was served, and costly duplication was common. Two services often competed for one customer, while both bypassed another customer who could not afford to pay enough. Three responses evolved over the years. One was outright public operation. Direct welfare was an outright public operation from the start. There are many other local and state examples: municipal liquor stores, municipal electric utilities, and, of course, highways. Another solution was public granting of an exclusive private franchise — for example, to an electric, gas, or telephone company-to avoid costly duplication, accompanied by rate regulation to try to ensure affordability. However, exclusive public operation or franchising created a monopoly within each governmental jurisdiction, with the risk of resistance to change or of selfish control by a specialized, politically powerful interest group. Thus a third approach was to retain the public monopoly but contract the operations to private firms on periodically reopened, competitive bids.105 In the 1980s, one or another of those principles had come to be applied in virtually all linear public services, from highways to power lines to school bus routes to police beats. Whichever approach was taken, rates and costs were averaged so that income from areas that were larger, wealthier, or more densely populated could help to provide service to areas that were smaller, poorer, or less densely populated. There was an implied assumption in those policies: the service area of the school, hospital, highway, or utility system is a geographical community of interest; there is a common benefit from raising the level of health and safety and the ability to communicate and carry on commerce. To be sure, the logic has sometimes been strained. The public monopolies have led to widespread benefits, bursts of vigilance, review, reform, reduction, and expansion, with constantly changing blends of ideals, images, and immediate issues. And their long-term evolution has scarcely begun.
(p. 218) Nevertheless, all the activity has required both employees and workplaces. Hence the number of government jobs in the Upper Mid-west-between 75,000 and 100,000 at the beginning of the auto era in 1920-had grown to more than 250,000 by 1946 and nearly 600,000 by 1980. The regional growth matched national trends, with adjustment for the slower growth of Upper Midwest population compared with national population as a whole. The picture varied for the three different levels of government in 1980. The federal government employed 99,000 people in the region-73,000 civilians and 26,000 military. Compared with other regions of the country, defense employment was weak, and so was employment in most of the civilian agencies. Only the Veterans Administration and Agriculture Department were comparatively strong employers. Federal jobs were geographically widely distributed. Forest Service and National Park employees were located mainly in the western mountains and North Woods, Fish and Wildlife Service employees in the glaciated wetlands areas. Veterans hospitals as well as the state and district offices of the various transportation and human services agencies were located at the state capitals and other principal cities. Department of Agriculture agents were dispersed most widely. They worked at every county seat and at the land grant universities.106 Several hundred employees of the Bureau of Reclamation and Army Corps of Engineers operated billions of dollars worth of public works at key points on the major rivers. Employment sites included the big dams on the Kootenai and Flathead in the Montana Rockies, and on the Missouri from Fort Peck, Montana, to Gavins Point, above Yankton, South Dakota. The Missouri's dams mark the historic riverboat route through the Great Plains. Visitors to the mammoth hydroelectric stations stand on meticulously landscaped grounds near the spots where the stockades of Forts Sully, Thompson, and Randall stood in 1870. Indians from the nearby reservation communities were employed at some of the dams in the 1980s. Army Corps of Engineers employees also operated the navigational locks and dams on the Mississippi from St. Anthony Falls southward toward St. Louis, opened in the 1930s; the small, turn-of-the-century dams that control lake levels in the Mississippi headwaters; the deep harbors on Lake Superior; and the locks at Sault Ste. Marie.107 But most of the 30,000 military employees—both active duty and civilian —were not in the Corps of Engineers (Figure 78). They worked at the six Upper Midwest air and missile bases. The number of military had grown from only a few hundred before World War II, and it was 10 times the total troop strength in the lonely stockades commanded from St. Paul in 1870. The military had returned to the region in some force after a lapse of nearly a century, but the orientation and scale had changed in keeping with the times. The bases in the 1870s had been aligned along the eastern and western frontiers of a 900-mile-wide swath of Indian-occupied shortgrass prairie. The bases in the 1980s - each about 500 to 1,000 times as extensive as its typical pioneer predecessor-were lined up on a northern frontier facing the heartland of the USSR across 5,000 miles of Canadian and Soviet boreal forest, tundra, and polar ice cap. And each was presumably a target for the warriors at similar bases in Siberia.108 Several thousand Agriculture Department employees played a particularly important role. They administered the direct payments to farmers under federal programs for production control and price support. Those payments accounted for 12 percent of the region's gross farm income in 1980, and Upper Midwest payments accounted for 18 percent of the national total. Whereas those payments were aimed at controlling production, additional indirect subsidies were paid to hold products off the market in times of low prices and to move marketed products into the channels of international trade. The combined effects of all federal agricultural subsidies equaled perhaps 4 percent of the total Upper Midwest economy. Thus, through the support of farm income, these subsidies were the underpinning for perhaps as much as one job in every 25. State employment within the region totaled about 160,000 in 1980. Roughly one-fifth of the jobs were located in the state capitals; the bulk of the others at state universities, hospitals, prisons, and highway district offices and garages. Aside from the big air bases, the states were the major factor in geographical concentration of public employment. In the entire region, there were only 15 counties with unusually large concentrations of nonmilitary government employees. Four of those counties included state capitals, and the other 11 had state university campuses. Local governments accounted for another 350,000 jobs. Employers included not only counties, cities, and rural townships, but also school districts and special districts with purposes ranging from airports and sewer operations to irrigation, drainage, and mosquito control. Employees in the greatest numbers ran the elementary, secondary, and vocational schools. County seats were especially important local government employment centers.
(p. 219)
Figure 78. Armed forces Employment in the Upper Midwest, 1980. Most of the 29,000 military employees - both active duty and civilian -worked at the six largest air and missile bases. Source: note 60.
(p. 220)
Figure 79. Local Tax Effort, 1977/79. Local government revenues from the communities own sources in 1977, in each county, are shown as a percentage of personal income of residents of the same county in 1979. Local effort was generally higher where state aid payments to local governments were lower. Sources: 1977 U.S. Census of Governments, vol. 4, table 36; 1957 Census of Governments, vol. IV, table 36; income data, see note 115.
(p. 221)
Table 7. Revenue Sources for State and Local Governments in Upper Midwest States, 1977 (In Percentages)
Financial support for local government jobs came from three sources: federal aids, state aids, and local taxes (Table 7). Both state and local governments received payments from the federal government to meet part of their expenses. Some of the revenue raised by the states was passed along to local governments to augment their own revenues. The percentage of local revenue derived from state aids varied widely in the region. In the late 1970s, state aids made up the highest proportion of local revenues, on the average, in Wisconsin, Minnesota, and North Dakota (Figure 79). Both Wisconsin and Minnesota established important precedents for state aids to local governments during the Great Depression. An avalanche of tax-forfeiture of submarginal, cutover land had left many North Woods counties at the edge of bankruptcy. Destitute small farmers could not leave quickly. They had no money to pay taxes, yet roads and other services had to be continued. Also, both states had comparatively come. Minnesota, in the earlier years, and North Dakota, in recent years, have had nationally based mineral income which could be taxed and redistributed. In contrast, local taxes made up a larger share of local revenues in Michigan, Iowa, and South Dakota. Federal aid payments were highest in South Dakota, North Dakota, and Montana. They reflected the impact of air bases on several local communities and the importance of payments to Indian populations in the reservation areas.109 While local governments in the region's states differed in the way they raised money, they were very much alike in the proportion of their citizens they employed. For local governments fulltime equivalent employment ranged between 3.1 percent and 3.5 percent of state populations. All the states were slightly below the national average. Minnesota, with high state aids and high expenditures, employed virtually the same percentage of its population in local government as did South Dakota, with low aids and low expenditures. The percentages of state populations employed in education alone were also quite similar, but those percentages were all substantially above the national average. On the other hand, the states differed greatly in the amount they paid public employees. Per capita expenditures of tax money from all sources for local governments in North Dakota and South Dakota were 33 percent to 40 percent lower than they were in Minnesota and Wisconsin. The differences reflected a combination of state aid policies, general local wage scales, and the political power of public employee organizations. Aside from the effects of state policies and traditions, there were some notable variations among different localities. Most variations reflected chance differences in the local history and timing of major public improvements and bond issues. The most systematic differences between places depended on size and commercial activity. The bigger and busier a place was, the more people it employed in its local government. Very little difference showed up across state lines. The amount of work to be done, and the number of people engaged to do it, seemed to be little affected by tax and expenditure policies —or vice versa. Predominantly agricultural areas that were less urbanized had two distinctive characteristics. First, they generally showed a rather high tax effort-percentage of personal income paid for local government taxes —regardless of the state. That was because average farm incomes reported to the Census Bureau were low, and real estate taxes, on large farms especially, were a big item. The lower income was probably partly the result of different methods of calculating farm and urban personal income for census reporting. But it is impossible to adjust the data to make the counties more nearly comparable. Farm counties had not only higher average tax effort but also more variation in tax effort from year to year. That simply reflects the fact that income varies drastically from year to year according to the whims of climate and markets, while many of the costs of local government cannot be changed very much on short notice. The saying that nothing is so sure as death and taxes applied especially to the farming areas, and most particularly in the semiarid country. After we had once watched an unusually vigorous discussion of a proposed bond issue at a rural town meeting, a small-town lawyer commented, "Whatever happens, these people will pay their taxes." Compared with the rest of the country, Upper Midwest government had some distinctive characteristics in the early 1980s. Its people made an exceptionally high tax effort per dollar of personal income for highways, protection and management of natural resources, and education (Table 8). (p. 222)
Table 8. Major Expenditures of State and Local Governments in Upper Midwest States, 1981 (In Percentages)
Even South Dakota appeared to be well above the average in expenditures per dollar of personal income, its low per capita outlay notwithstanding. Public expenditures for health care (not included in the accompanying table) appeared to be low except for Minnesota. But those numbers did not reflect actual performance -partly because the region's traditions in religion and voluntary organizations gave it an especially large dependence on private hospitals and nursing homes, and partly because of the multistate geographical focus on specialized facilities at Rochester's Mayo Clinic and the Twin Cities. In the Twin Cities-Rochester concentration, the Upper Midwest supported a regional medical service center that ranked in the top half-dozen in the nation. Higher ratios of physicians to population occurred only in the giant centers of New York and California and amid the almost immoral affluence of the national capital and its suburbs. Furthermore, the Upper Midwest ratio was growing at a rate comparable to the growth of New York City and Chicago and ahead of other areas except for metropolitan Washington, D.C. The outlying areas of the region supported health care at a level comparable to other parts of the United States with similar degrees of urbanization. But the Upper Midwest growth in number of physicians per capita exceeded that of any other area of the country—again with the exception of the national capital.110 In their sum, these characteristics reflected low population density, high standards, willingness to do what was necessary and practical to meet high standards at low density, and considerable diversity of approaches to the problem. E. A. Willson's pioneer study of social conditions in western North Dakota, in the raw, hard years of the early 1920s, would remind any reader that many regional characteristics of the 1980s still reflected the spirit of the early settlers of the northern Great Plains.111 Meanwhile, the growing role of government enterprise had helped to reduce somewhat the coherence of the region. To be sure, the regional business services and financial network was virtually unchanged in pattern and intensity. But wholesaling became more dispersed in the auto era; the migration stream lost some of its regional focus; and the growth of a second national metropolis in California to rival New York had divided some of the region's national business contacts between East and West. The main stream still went through the Twin Cities to New York. But another stream went to California through either the Twin Cities or Denver. In addition to those changes in the private sector, the booming state and federal share of the economy focused on the individual state capitals rather than on centers of private business. Hierarchical lines joined the capitals with a different set of places outside the region. Contacts with the federal regional centers most likely led to Denver or Chicago, perhaps to Omaha or Kansas City. The channel to national headquarters passed through the Twin Cities but on to Washington, D.C., instead of New York. Growing public efforts promoted economic development through agencies of state and local government. The efforts focused on retaining, attracting, and helping to incubate businesses within the state or city boundaries. First, the promotion tried to ensure employment opportunities for state or local people entering the labor force, or to ensure continued employment for people who already lived and worked there. Second, the promotion sought to ensure growth, or no decline, for the tax base to support the local public enterprise. The governments used several types of subsidy to private firms in these promotions. Funds came from their own taxes and borrowing power, sometimes in conjunction with federal grants. Subsidies were used to cover credit risks that could not justify private loans, to reduce interest rates below market level on development loans, or to reduce costs of constructing and leasing buildings. All those programs were still further extensions —some said distortions-of the role of governments as agents and organizers of communities in search of both individual and collective security. It seemed highly unlikely that those efforts could significantly reorganize or balkanize along state lines the nation's resources or its markets for labor, commodities, or factory goods. But in the 1970s and early 1980s, the programs did have a localizing effect within the Upper Midwest and other regions as well. Shifts of businesses into South Dakota were the principal Upper Midwest example.
(p. 223)
Thus, while Upper Midwest government employment more than doubled in the auto era, the increase was symptomatic of important factors that had somewhat diluted the economic coherence of the region. But that was only a small side effect of the region's adaptation to the new global and national environment of the auto era. A New Round of Adaptation In the 1970s and 1980s, the region appeared to be headed into a second round of adaptation and transformation.112 An intercontinental land-air-electronic network was in place. There was a rapidly intensifying world exchange of factory products, commodities, knowledge, and capital; a world market was emerging in industrial labor, engineering, management, and professions. Important technological changes in agriculture, medicine, and waste recycling seemed likely, if not imminent. Major changes in the organization of health care, banking, transportation, and agriculture appeared to be under way. Upper Midwest markets were more open than they had ever been to world-wide producers of services and goods. Even more than before, Upper Midwest firms had to reach out to the nation and world to expand or keep abreast of national growth rates. Then there was the enigma of significant climatic change due to the increasing carbon dioxide content of the earth's atmosphere.113 Some scientists saw such a climatic change as a possibility; to others, it was a virtual certainty. The effect in the Upper Midwest would be more variable rainfall, slightly milder winters and warmer summers, though the climate still would be the most extreme in the country. Even the more certain trend toward higher average age of the American-born population left abundant room for speculation about its effects. In the early 1980s, demographic projections put the region's population at 9.1 million by the year 2000 —a gain of about 1.1 million from the 1980 census (Table 9 and Figure 80). At that rate, the region would continue to grow more slowly than the nation as a whole. Its share of national population would continue to decline slightly because of continued net emigration to the West and South, and despite continued immigration from the East.114 The Twin Cities area would account for more than 40 percent of the region's growth. But density would continue to decrease in the Central Counties and build up in the Commuter Ring. Strong growth would continue in the Twin Cities Satellite Ring, in the lake regions of north-central Minnesota and northern Wisconsin, in the zone of spreading urbanization and industry in the eastern Dakotas, in the new metropolitan areas of the Great Plains, and in the Western Montana Valleys. Net growth would continue to be slow in the rural parts of the Corn Belt, and near zero in much of the Great Plains and North Woods. Urbanization would continue at a slowed pace in the smaller cities and towns of the Corn Belt and Great Plains. Farm population would decline further, from 620,000 to about 370,000, and make up only 4 percent of the regional total in the year 2000. The projected changes were not dramatic in either numbers or geographic pattern. But a great deal of turbulence churned beneath the rather smooth surface. Past performance indicated that in the average Upper Midwest county, in any given decade, the actual nonfarm population change would be nearly 50 percent more or less than the long-term projection. And the turbulence of the demographic stream would continue. With a net growth of 1.1 million for the two decades from 1980 to 2000, a total of 7.7 million would be born, move into or out of the respective states or die. To those measures of population turnover and short-term variability of growth rate, add the effects of the region's changing position within the uncertainties of the world circulation system and climatic trends. Yet all those sources of change and uncertainty would also be sources of opportunity for new enterprises and organizations created by people who live in the region. Adaptation and innovation, community and continuity would be still more important in the half-century following the 1970s than they were in the half-century preceding.
(p. 224)
Figure 80. Projected Percentage Change in Population, 1980-2000. Source: note 114.
(p. 225)
Table 9. Projected Population in the Upper Midwest, 1980-2000 (In Thousands)
|
|
|